


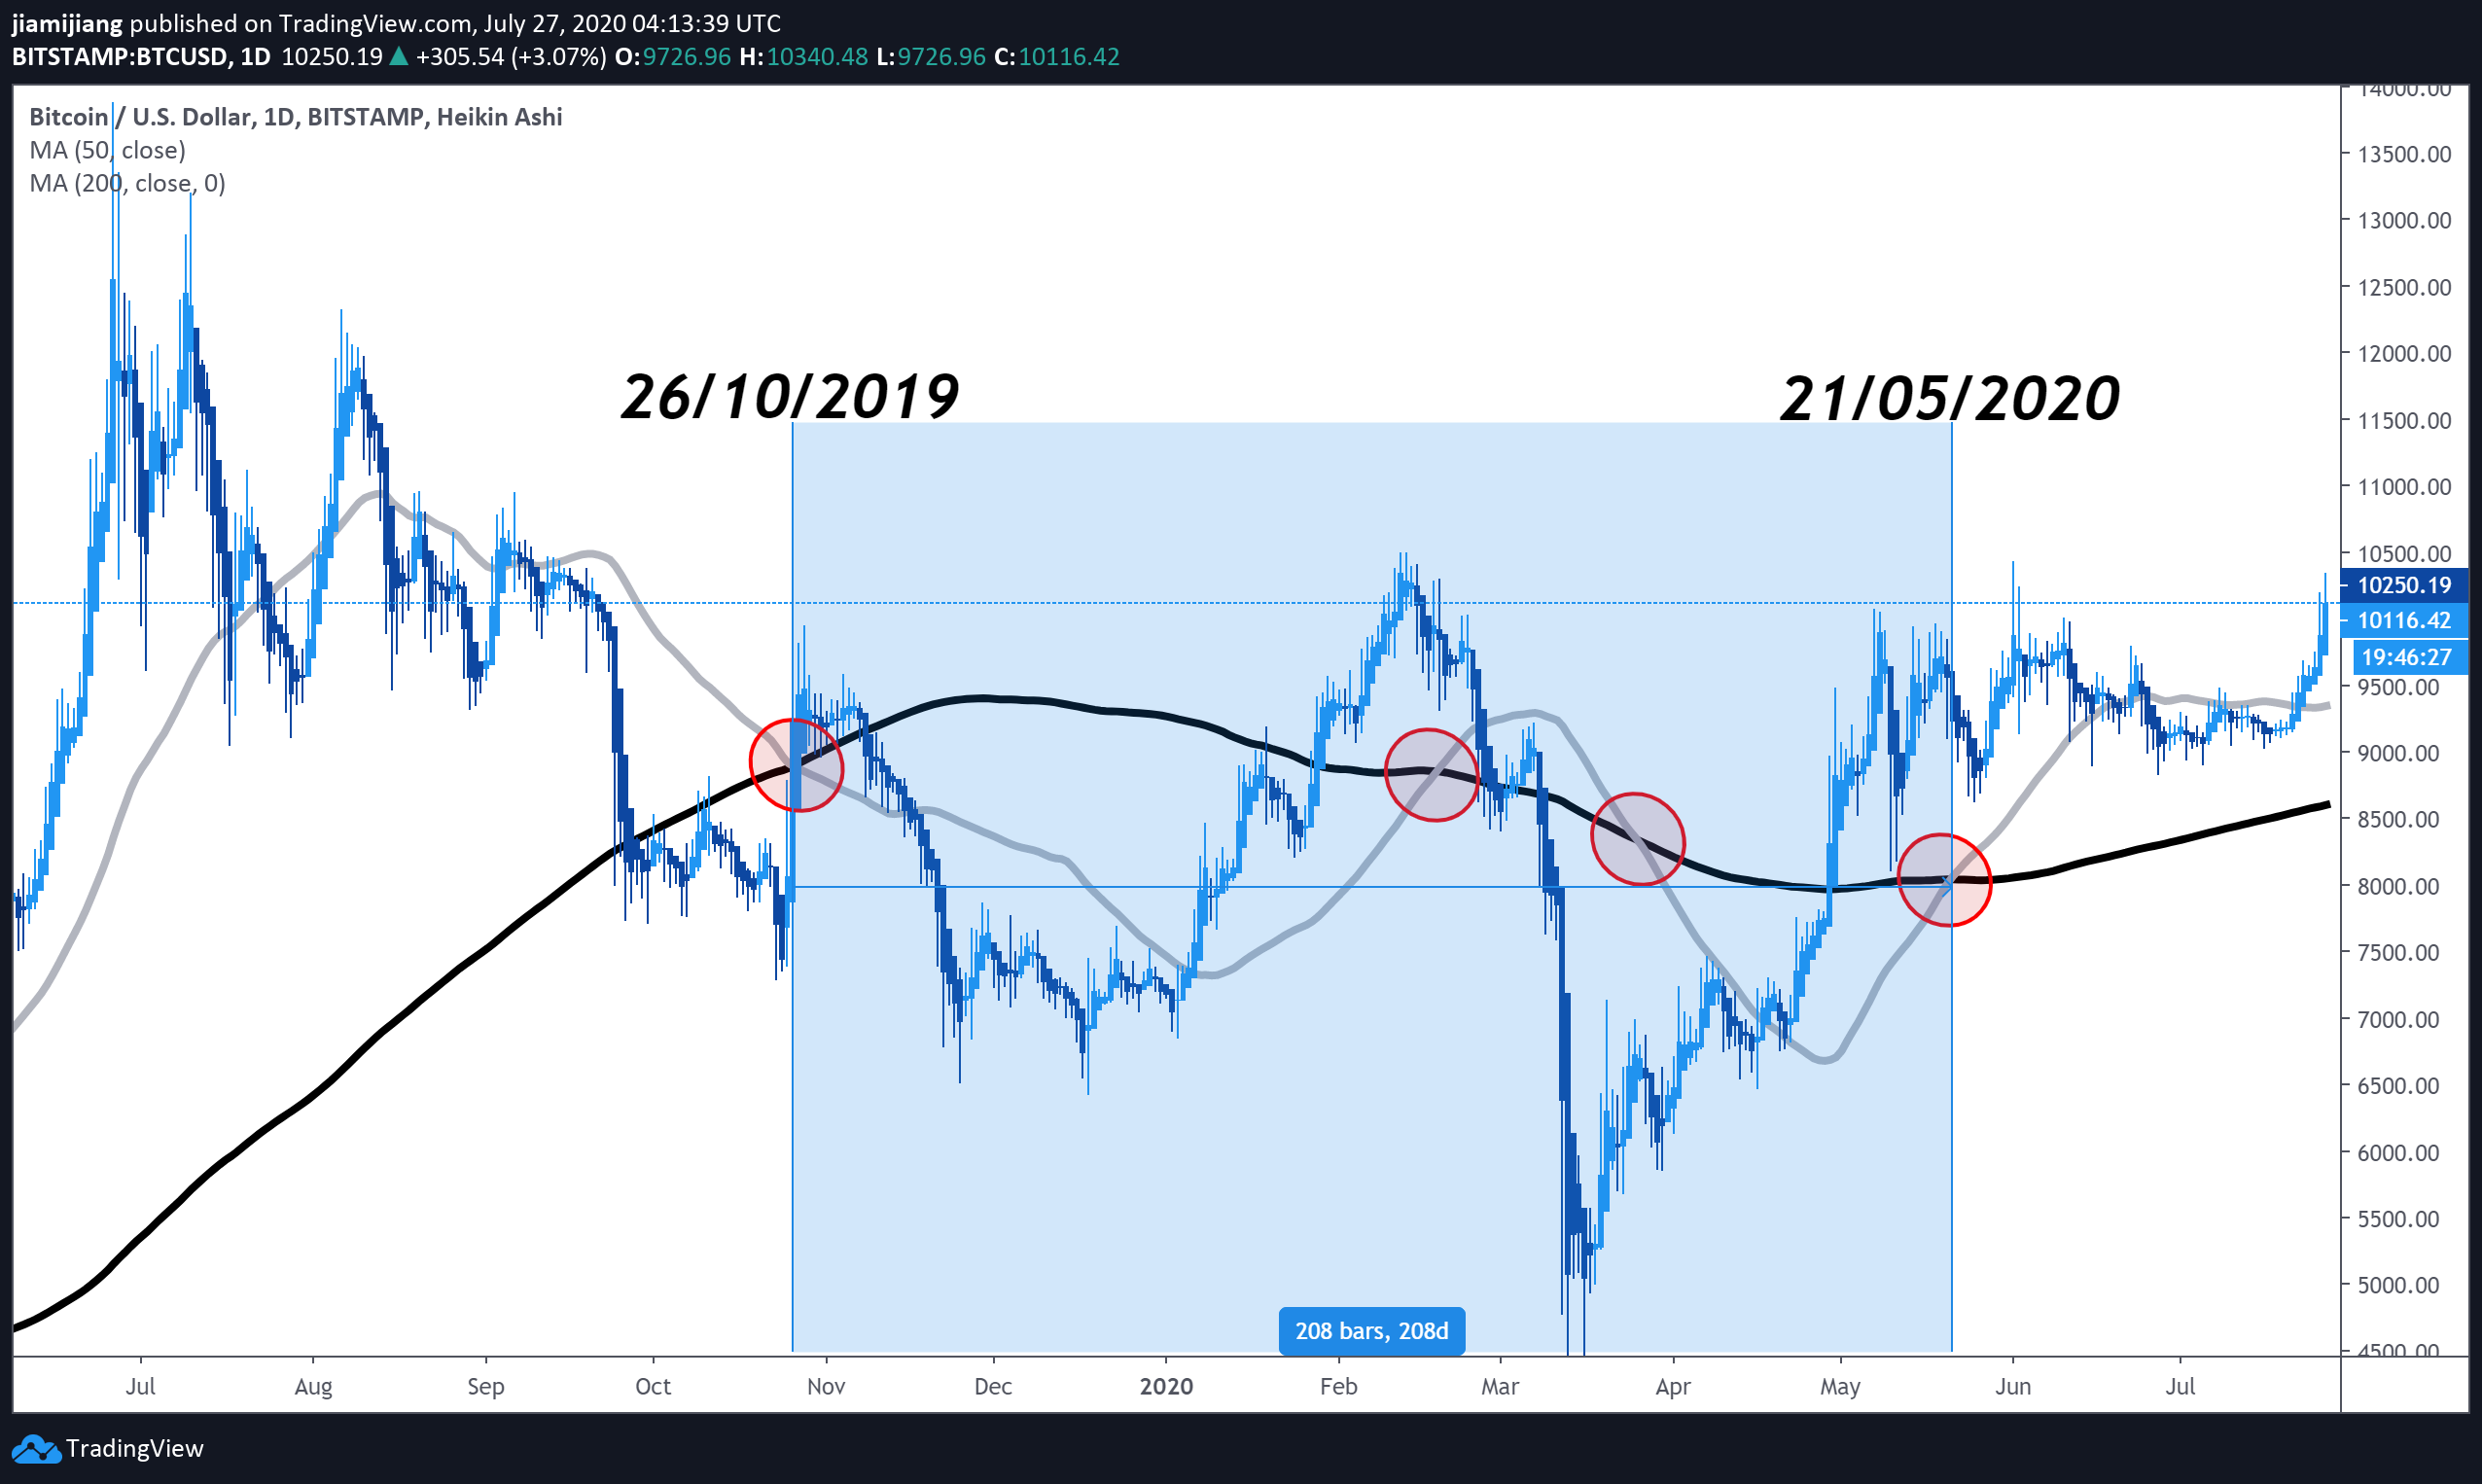
(Figure 1) From October of 2019 to May of 2020, the 50D and 200D SMA have met a total of 4 times.
Over the past year, Bitcoin’s technicals have done something
that has never been done before in its over 10 year history. BTC’s 50D and 200D
SMA have crossed over each other 4 times in less than a year with the 50D
currently comfortably hovering above the 200D.
In trading, one of the most widely used technical indicators
are the Simple Moving Averages. As the name suggests its simplicity allows
traders to see if there is any signal indicating if a price of an asset is headed
towards a bull or bear run. That signal has been characterized by the
intersection of the 50D SMA and the 200D SMA due to their ease of recognition.
When the 50D SMA crosses upwards breaking through the 200D SMA, this is coined as a Golden Cross in hopes that the recent upward price trend will persist. And vice versa when the 50D SMA crosses downwards breaking through the 200D SMA, this is coined as a Death Cross as trader embrace for continued downward pressure on the price.
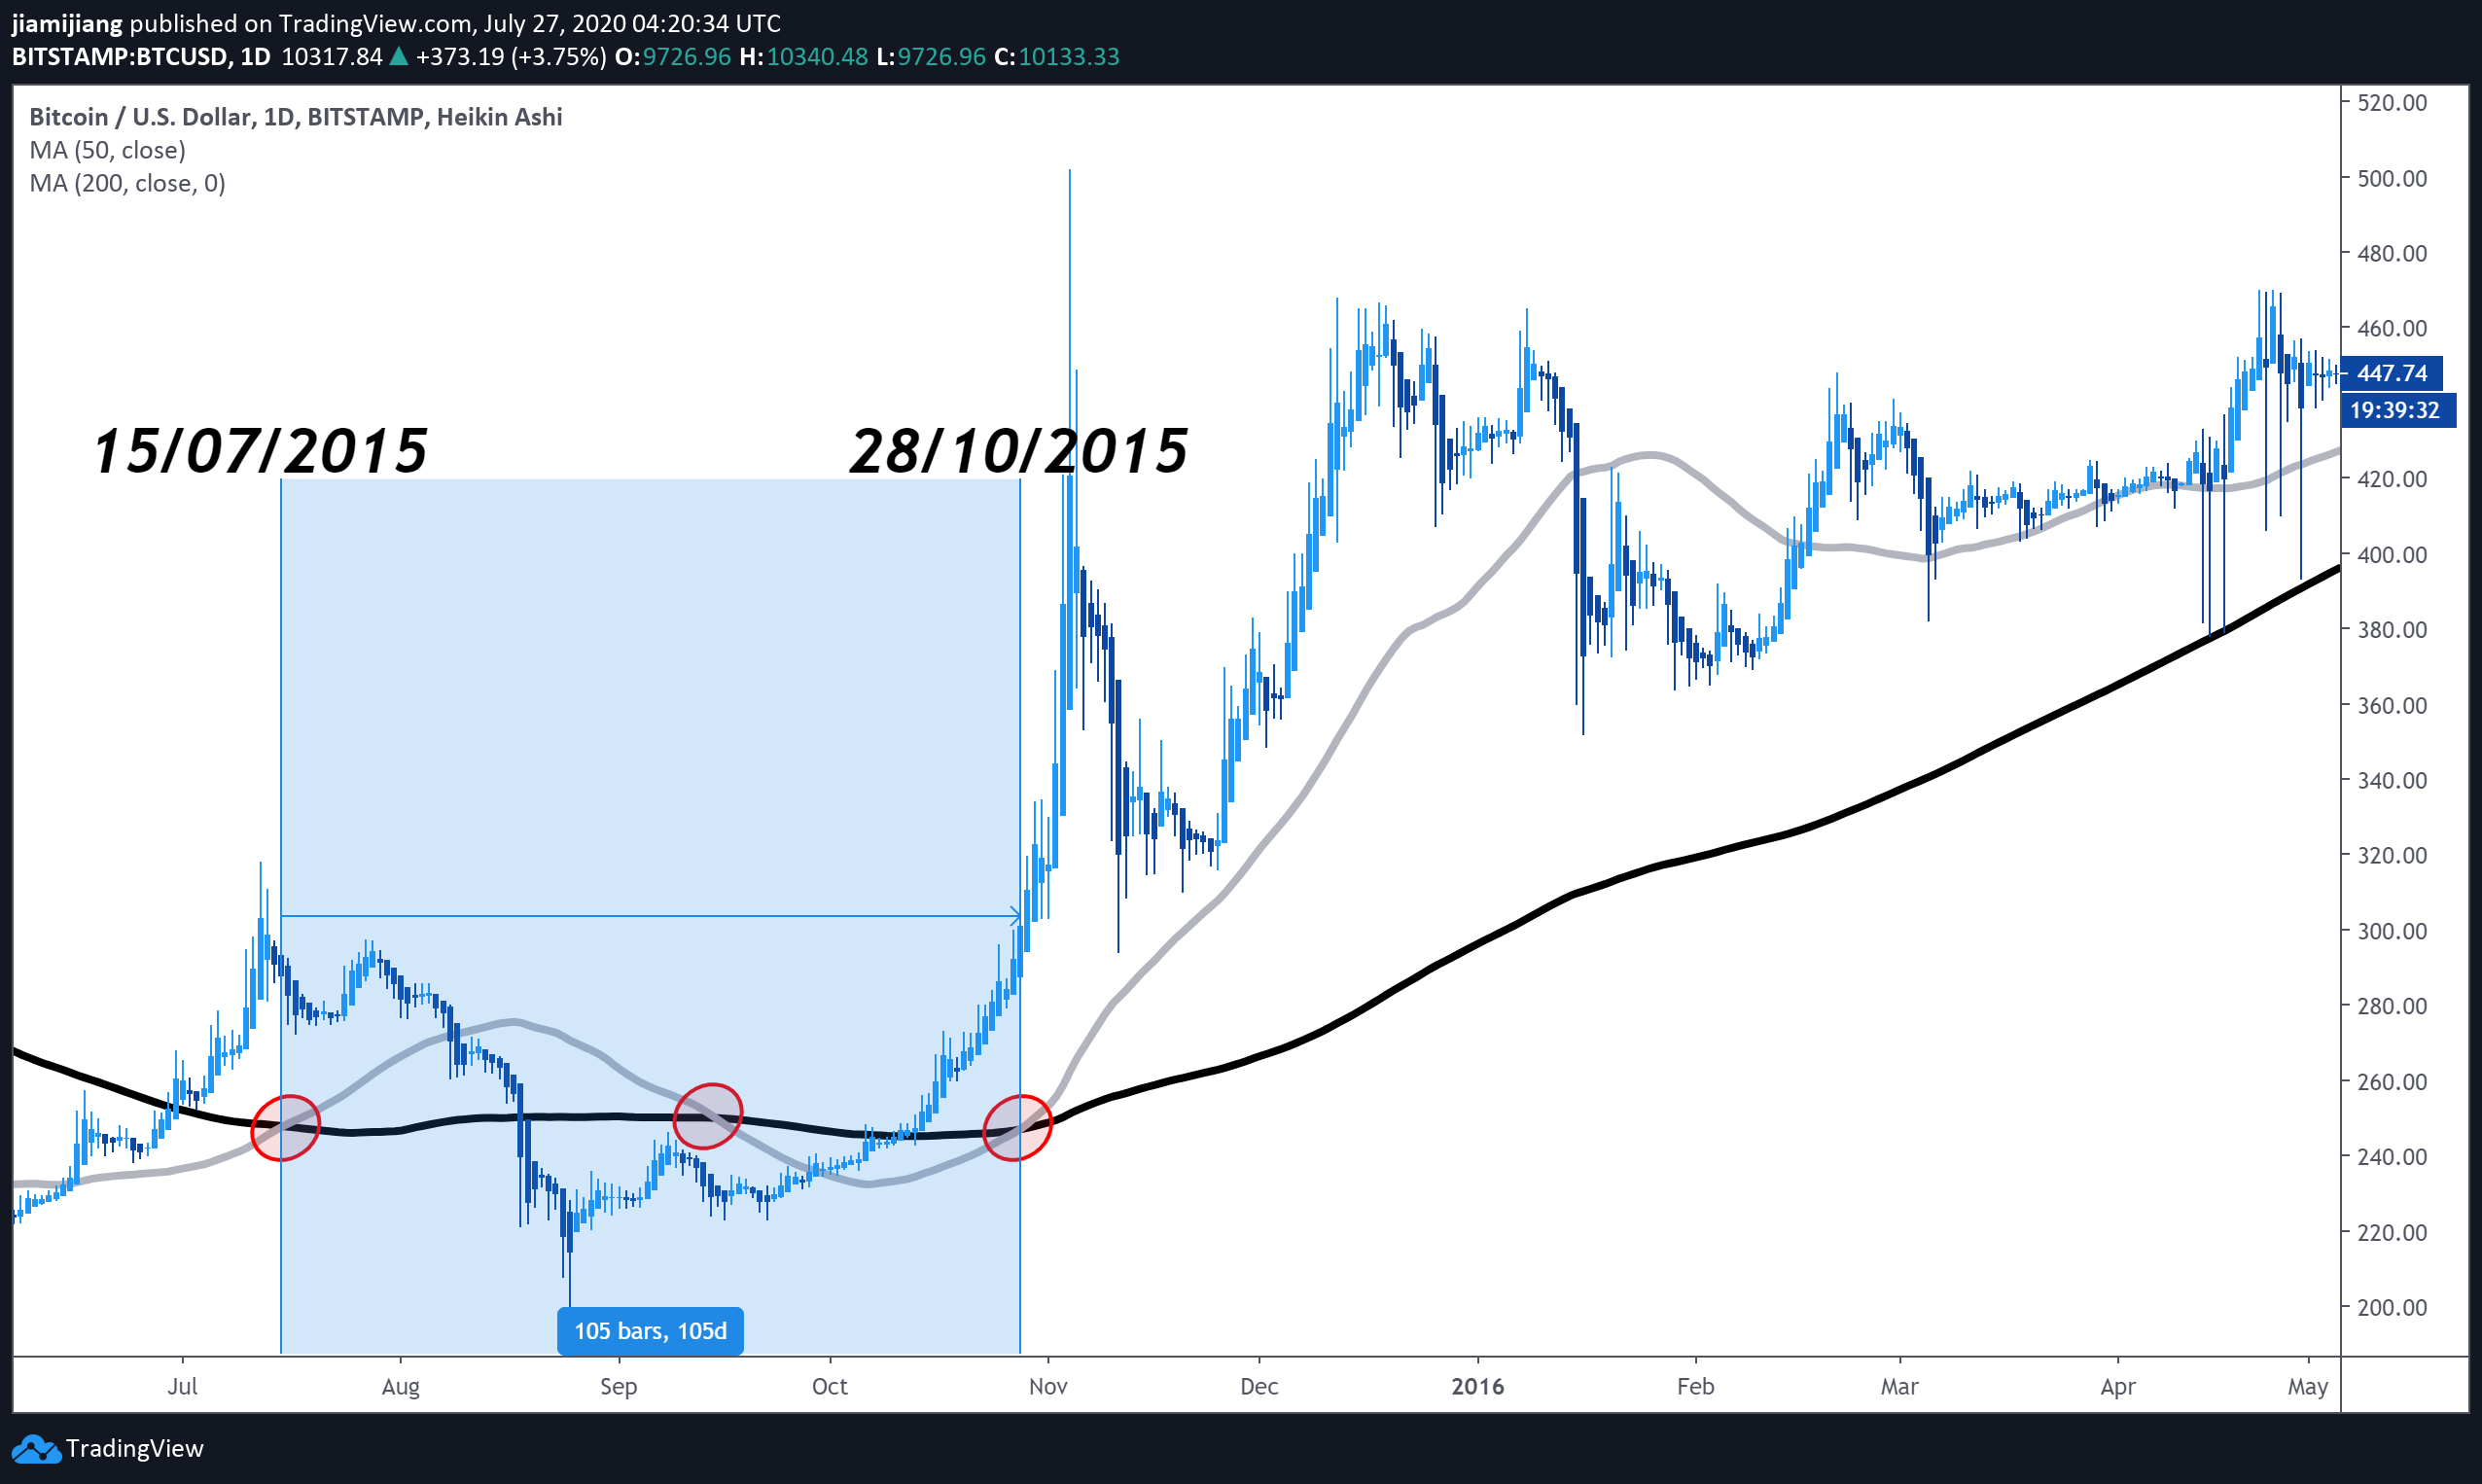
(Figure 2) The last time multiple crosses of the 50D and 200D SMA happened was right before BTC’s hyperbolic bull run of 2016 and 2017.
The last time BTC’s 50D and 200D SMAs have intertwined with
each other in such a short time frame was back in 2015 when it experienced 2 Golden
Crosses and 1 Death Cross. And in retrospect, the Golden Cross that was
witnessed on October 28, 2015 was a precursor to the hyperbolic bull run BTC
experienced all the way up to December of 2017. Price went from $245 to around
$19,600 constituting an 80x growth in a matter of 2 years.
Another instance of 3 crosses happened during the span from
April 2014 to September 2014.
This time around, the most recent cross was a Golden Cross occurring
on May 21st of this year. At press time, BTC’s price has forced its
way past up the phycological $10,000 resistance level. With the Golden Cross
happening back in May and BTC’s price finally above $10,000 again all on the
back drop of BTC’s third halvening, is this the time when we finally see BTC’s
price make another hyperbolic bull run?

 APP
APP