
Will the Bitcoin price be able to hold above $108,000 by the end of this week? This is the question that prediction platform Myriad is asking traders. As the deadline approaches, traders are facing a critical moment of decision.
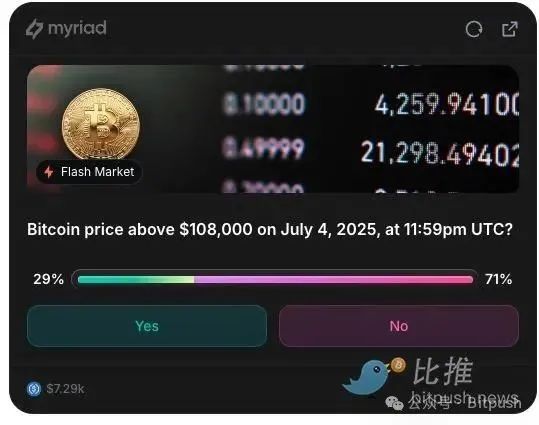
Just yesterday, when Bitcoin was trading around $107,640, a breakout above that level seemed certain to happen. At the time, only a 0.33% gain ($360) was needed to reach the target, and the proportion of bets on the Myriad platform was basically flat, with bears leading by a narrow margin of 50.8%.
However, the situation has taken a sharp turn for the worse today. As Bitcoin fell back to the key $106,000 level (a price to watch in July), the odds on the Myriad platform changed dramatically. Forecasters now believe that there is a 69% chance that Bitcoin will not break through $108,000 before July 4, indicating that this week may end in a bearish trend.
So, what does the chart data reveal about Bitcoin’s trend?
Bitcoin price: What the charts reveal
As Bitcoin hovers below the psychological level of $108,000, the question is not whether the price can reach that level, but whether it can close firmly there - there is a fundamental difference between the two.
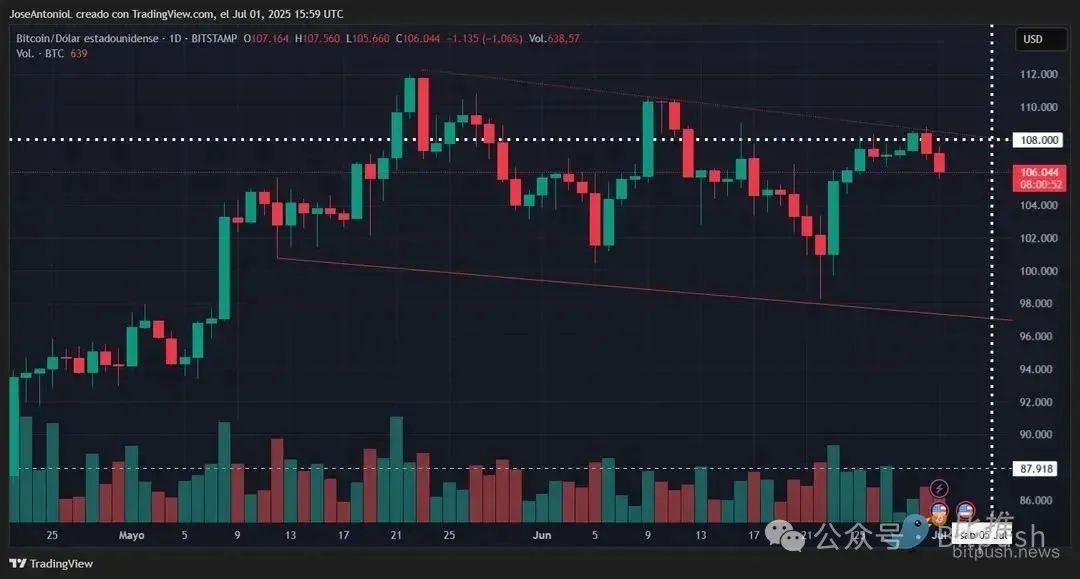
By analyzing the 4-hour candlestick chart, it can be found that in the 30 trading sessions since June 25, Bitcoin has only closed above $108,000 three times. More importantly, after June 9, Bitcoin has never closed above this level on a daily basis - throughout history, Bitcoin's daily closing price has only exceeded this threshold eight times.
However, for day traders, technical analysis at the 4-hour level can provide key insights into this short-term forecast:
From a purely technical perspective, Bitcoin is facing the typical dilemma of being "within reach but out of reach". The 4-hour chart shows that the price has been repeatedly sold off in its attempts to break through the $107,500-108,000 range. These failed breakout attempts have left a clear upper shadow on the candlestick chart, indicating that buyers' attempts to push prices higher have been repeatedly met with strong sniping by sellers at resistance levels.
This close proximity is extremely deceptive. Although a 2% increase may seem insignificant in the cryptocurrency market, where daily volatility often reaches 3-5%, the fact that this key level has been repeatedly breached suggests a deeper market mechanism. For traders holding positions, if this resistance level can be effectively breached, it will mean that bulls have enough momentum to push prices to new highs in the short term.
The Average Directional Shift Index (ADX) is currently reading 17, well below the 25 threshold required to confirm trend strength. This weak reading shows that Bitcoin is in a state of trendless volatility, which is particularly unfavorable when trying to break through key resistance. A low ADX environment often causes prices to fluctuate between support and resistance levels rather than achieving a decisive breakout.
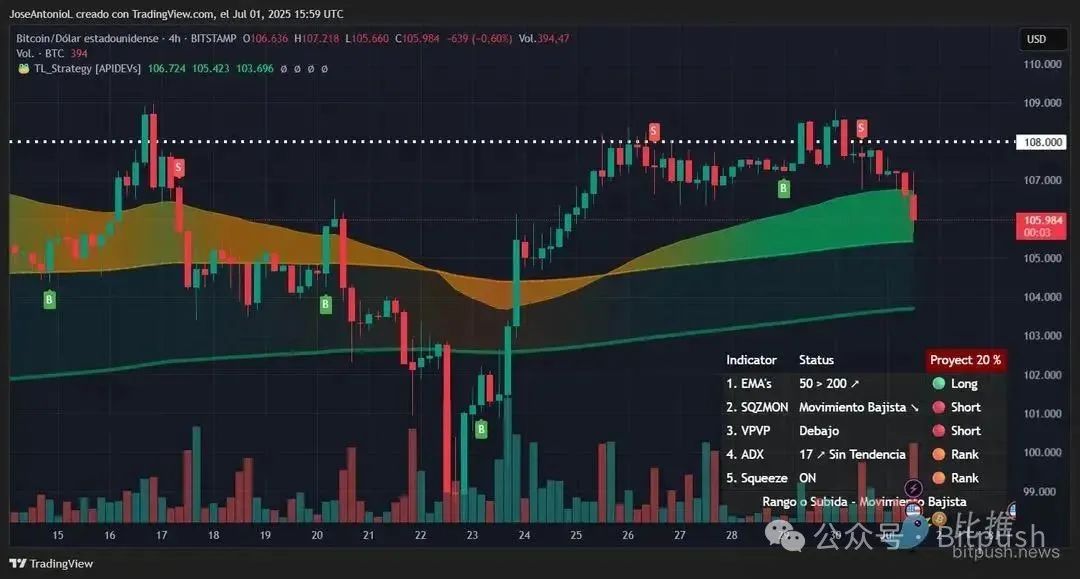
Specifically speaking of the current trend, Bitcoin has been fluctuating repeatedly in the range of $107,000-108,000 since June 25: sometimes it is lower than this level, and the breakthrough times are fewer, but it always returns to the horizontal channel, which confirms the judgment of the lack of a clear trend in the short term and verifies the accuracy of the ADX indicator.
The squeeze momentum indicator shows that bearish momentum is brewing in the market, indicating that the downside trend is dominant in the shorter term. This bearish pressure is directly contrary to the bullish momentum required to break through $108,000. In short, traders currently seem to be more inclined to believe that the market will see a bearish correction rather than continue the long-term upward trend.
However, there is one technical indicator that still holds a glimmer of hope: the exponential moving average (EMA). This indicator guides trading decisions by calculating the average price over a specific period. Continuing to look at the 4-hour chart, the 50-period EMA remains above the 200-period EMA, maintaining a bullish "golden cross" structure. This alignment suggests that despite the weakening of short-term momentum, the overall trend remains up.
However, the price has fallen below the 50-period EMA, indicating short-term bearish pressure.
Another indicator that can be helpful is the visible range volume distribution. The price is currently trading above the point of control, which is usually a bullish sign. However, since the price is also approaching resistance and lacks momentum, a pullback (i.e. "mean reversion") is more likely.
Volume distribution charts can highlight the most active price areas - these areas often form natural support or resistance because traders often set take-profit or stop-loss orders there. For example, after you open a position at a certain price, you may set a stop-loss at the same level to control your risk.
Although the current price is in the buy zone of most traders (slightly bullish), it is not enough to judge market sentiment due to the unclear direction.
Weekend Effect
A key factor that is often overlooked is that July 4th falls on Friday in the United States, while the forecast deadline is 23:59 UTC (which is already early Saturday morning for most global markets).
Weekend trading is usually accompanied by a decline in institutional participation, shrinking overall trading volume, and widening bid-ask spreads. Basically, only cryptocurrency "die-hards" are still active because this market never sleeps.
This environment makes a sustained breakout above key resistance levels more difficult – there simply isn’t enough buying to absorb the selling pressure.
Conclusion: It is easy to reach the top, but difficult to maintain it
Based strictly on chart analysis, the probability of Bitcoin hitting at least $108,000 before the July 4 deadline is still high - after all, it only needs less than 2% to rise. But to close above that mark? It seems unlikely at the moment. Here are the reasons:
- Historical Rejection Rate: The chart shows that at least 4-5 recent attempts to break through this area have failed, setting a statistical precedent.
- Momentum Divergence: Although prices are near highs, momentum indicators (RSI, ADX) show weakening momentum – a classic top divergence pattern.
- Time loss: As the deadline approaches, momentum decays, and every hour that passes without a breakthrough reduces the probability of success.
- Volume Requirements: Sustained volume is required to break through and hold a new price level, and a weak ADX reading indicates insufficient volume.
- Liquidity dries up over the weekend: The cut-off time coincides with a critical moment for institutional funds to withdraw.
Of course, the above analysis is based on the premise that the market environment remains unchanged. But this is the cryptocurrency market, and everything is possible. When Bitcoin is only 0.33% away from the $108,000 target, even a small catalyst such as a single large order, a political statement, a "whale" move, or social media sentiment can completely change the outcome. Although the chart shows that the resistance level may hold, the predictive effectiveness of traditional technical analysis is inevitably discounted in the face of such a small gap.
Key price tips:
- Immediate resistance level: $108,000 (forecast target)
- Key support level: $105,000 (psychological level)
- Next resistance after breaking through: $110,000 (previous high area)
For forecast market participants, this technical pattern suggests a binary outcome that favors a failure rate - similar to opening an over-leveraged long position. However, as the deadline approaches, external catalysts are likely to play a decisive role. It is recommended to pay close attention to early signals of a sustained breakout, such as volume growth and ADX breaking 20, while being alert to breaking news that may temporarily invalidate technical analysis.
Moon or Doom: Will Bitcoin See Fireworks on July 4
