
Growth signals and capital boom mask structural risks, and the market may enter a high-level oscillation phase
- The macro environment is warmer: Trump's easing trade rhetoric + cooling inflation boosted market sentiment.
- Fund momentum weakened: stablecoin and ETF inflows continued to decline, and new buying was clearly insufficient.
- Price and momentum diverge: BTC rises but funds, OTC premiums, and ETFs cool down simultaneously, and the risk of a pullback increases.
- Strategic recommendations: Prioritize defense, pay attention to the BTC 100,000 support and ETH's pullback rhythm, and it is suitable to reduce positions of altcoin high-Beta targets when they are high.
1. Macro and market environment
Trade fluctuations and CPI data have caused short-term market chaos. The corporate bond boom has supported the stock market but exacerbated the U.S. debt crisis. The high leverage of consumers and companies coupled with the Federal Reserve's policy restrictions have led to systemic liquidity risks beginning to emerge.
2. Analysis of capital flows & market structure of mainstream currencies
External Funding Flows
- ETF funds: 609 million inflows this week, and the inflow volume continues to decline
- Stablecoins: 877 million new issuances this week, 112 million new issuances per day, low issuance levels
Market sentiment indicators
- OTC premium: Stablecoin premium continues to decline underwater
Bitcoin (BTC)
- Technical analysis: The market is in a volatile upward range
- On-chain chip distribution: Chips above 10w are enhanced
Ethereum (ETH)
- The trend is weaker than BTC. ETH/BTC maintained volatility and then broke down this week, and funds continued to flow back to BTC dominance.
- On-chain changes: The increase in active addresses may indicate that the staged bottoming out has been completed.
Macroeconomic Review
Review of May CPI data and Trump's speech


2. Macro Research: How ADP Employment Data Affects BTC Prices
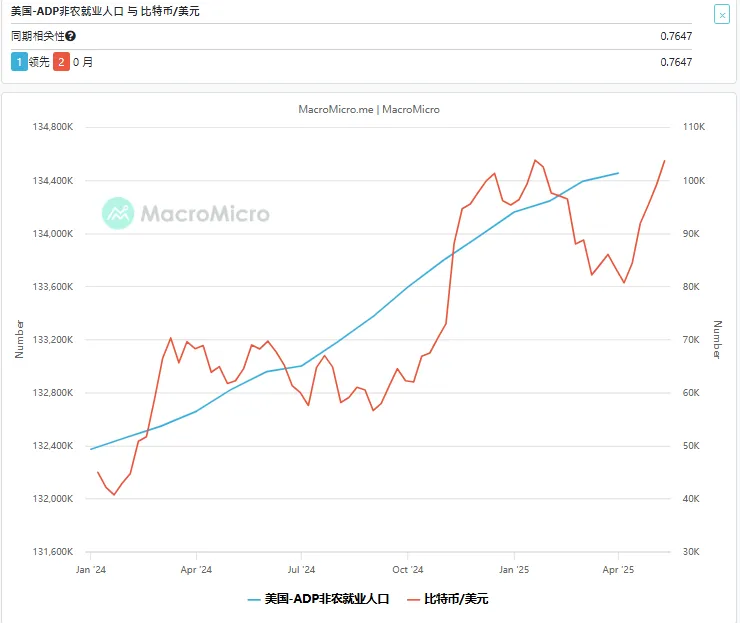
1. Directional consistency: When ADP data significantly exceeds expectations, the probability of BTC rising significantly increases
Statistical evidence:
- In 16 of the 28 ADP data releases, ADP exceeded expectations by ≥ +10%;
- 15 of these times (about 94%), BTC rose within 7 days;
- The average increase was +6.8%, significantly higher than the overall sample mean.
Cause Analysis:
- Strong employment is seen as a sign of economic recovery and could reduce market concerns about a recession.
- Although theoretically strong employment may be bearish for risk assets (due to increased expectations of interest rate hikes), in actual observation, the market often interprets it as "increasing confidence" in the short term → funds enter the crypto market;
- At this time, BTC shows an upward bias, especially when the market was originally in a "wait-and-see" or "low volatility" state.
2. Moderate changes: Even if ADP significantly exceeds expectations, BTC's gains are still limited
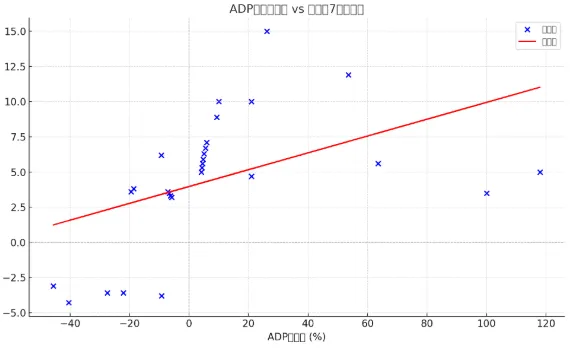
The regression results show that for every 1% increase over expectations, BTC rises by about 0.06% on average;
- For example: +50% exceeded expectations, corresponding to a 7-day increase of BTC ≈ +3%;
- This means that BTC’s price elasticity to a single macro metric is relatively limited.
3. Correlation is not a strong causal relationship: some BTC surges are due to macroeconomic background resonance or crypto market events
- ADP can be considered as a secondary sentiment indicator, but its influence alone is not enough to determine the direction of BTC;
- The actual trend needs to be judged in combination with macro policy signals and crypto’s own event drivers.
Strategy Application
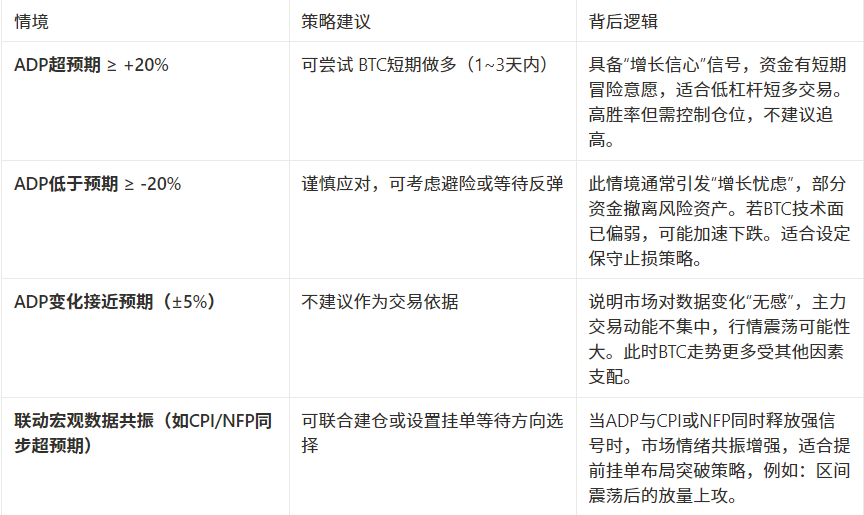
1. Strategy module construction:
- A "macro event factor" can be set up, with the ADP release date as the event window and ±10% as the trigger factor weight;
2. Emotion monitoring linkage mechanism:
- If ADP exceeds expectations and NDX strengthens and the interest rate curve steepens, BTC will have strong short-term bullish sentiment;
- If ADP is stronger than expected but the market expects a tightening scare, the effectiveness is weakened.
Key data to watch next week

2. On-chain data analysis
1. Changes in short- and medium-term market data that affect the market this week
1.1 Stablecoin Fund Flow
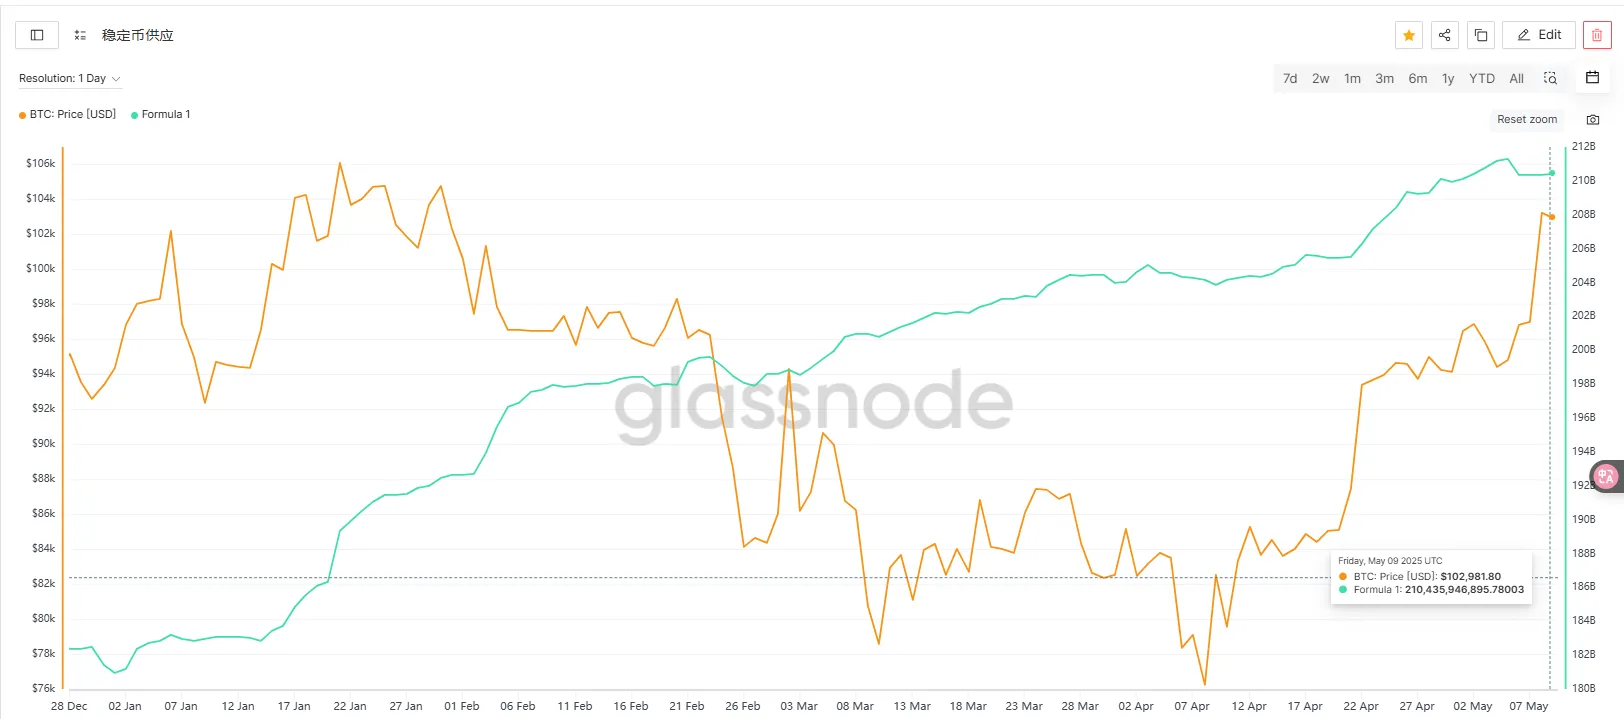

This week (May 9 to May 15), the total amount of stablecoins increased slightly to 211.256 billion, and the issuance amount was only 877 million, a sharp drop from the previous period. The average daily issuance fell to 125 million, a new low in the past four weeks, indicating that the capital inflow has slowed down significantly. The slowdown in the pace of issuance may reflect that the market has entered a wait-and-see phase, and liquidity has weakened marginally in the short term, so we need to be vigilant about potential consolidation pressure.
Marginal contraction of liquidity: reducing funding momentum
Stablecoins are the "dollar entrance" to the crypto market, and their issuance volume represents the willingness and speed of new funds to enter the market to a certain extent. The slowdown in issuance means less available funds flowing into the market and weaker price driving force. The buying demand in the market may not be enough to support the continued upward movement of assets, especially suppressing the subsequent rise of high-Beta assets (such as altcoins, NFTs, etc.).
The short-term market may enter a consolidation period
In the context of slowing capital inflows, if there are no new catalysts (such as major positive news, policy shifts, etc.), the market will find it difficult to continue its unilateral upward trend and may experience volatile consolidation or even a phased correction, especially in sectors that have previously seen higher gains.
1.2 ETF Fund Flow
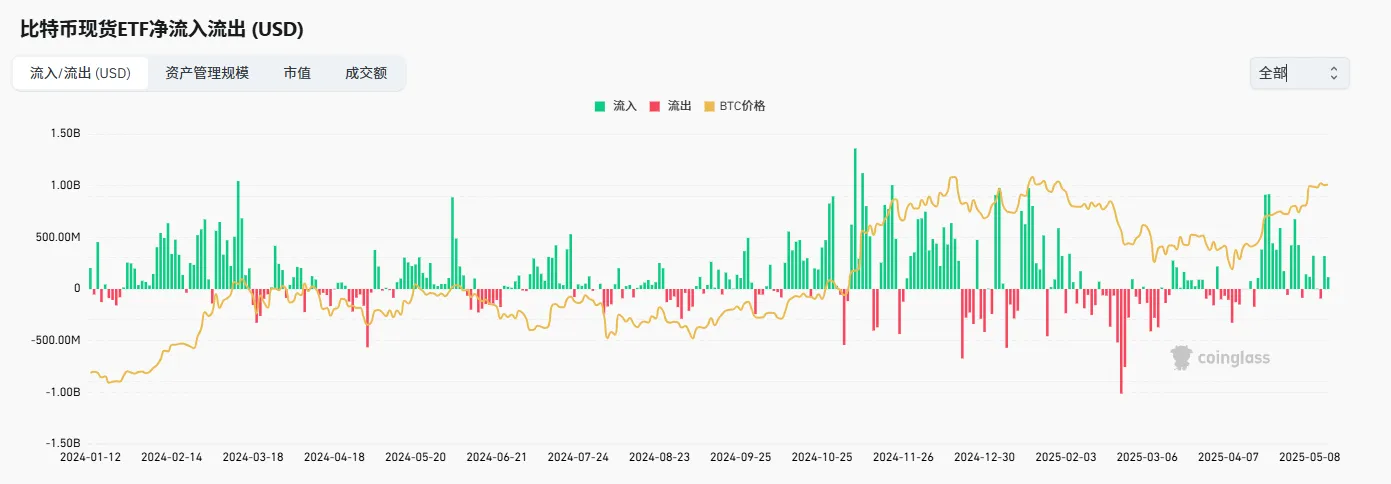
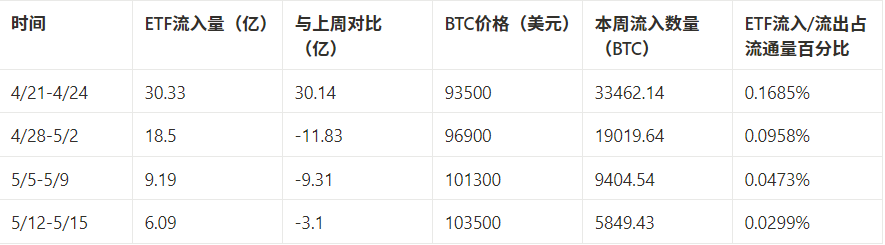
BTC ETF has slowed down its inflow for three consecutive weeks, with only a net inflow of 609 million this week. The marginal influence of funds has declined significantly. Although the price is still in the upward channel, it deviates from the basic funding level and there is a risk of weak growth and adjustment. If the subsequent ETF inflow does not pick up significantly, coupled with the slowdown in the issuance of stablecoins, the market may enter a medium- to short-term shock or technical correction stage.
Funding heat cools down quickly
ETF inflows have continued to decline over the past three weeks, dropping sharply from a peak of 3.033 billion to 609 million, a drop of 79.9%. If inflows continue to weaken, BTC prices will face the risk of a correction due to "loss of funding support."
Prices rise but momentum weakens
Although the BTC price rose from $93,500 to $103,500, ETF inflows continued to decline, indicating that the price increase was more driven by previous momentum inertia or market speculation rather than new capital support; the current price has deviated from the main range of ETF holdings, and the market is facing upward weakness or short-term correction pressure.
1.3 OTC Discounts and Premiums
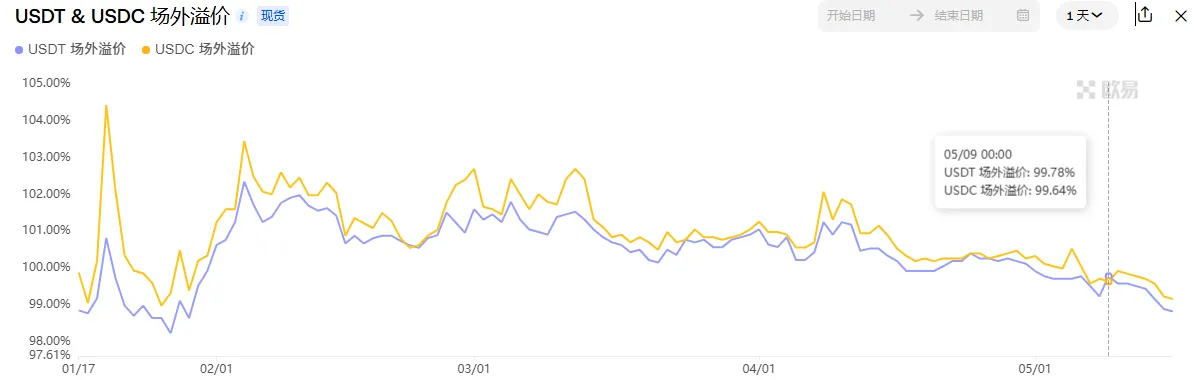
This week, the OTC premium and discount continued to move downward, diverging from the price, indicating that the OTC fund inflow is weakening and the market's new momentum is weak. This trend is consistent with the decline in the issuance rate of stablecoins and the sharp decline in ETF fund inflows, indicating that the market is in the stage of stock game and lacks new driving forces. In the short term, without policy or macro-catalysis, the market will be more likely to remain volatile or face further adjustment risks.
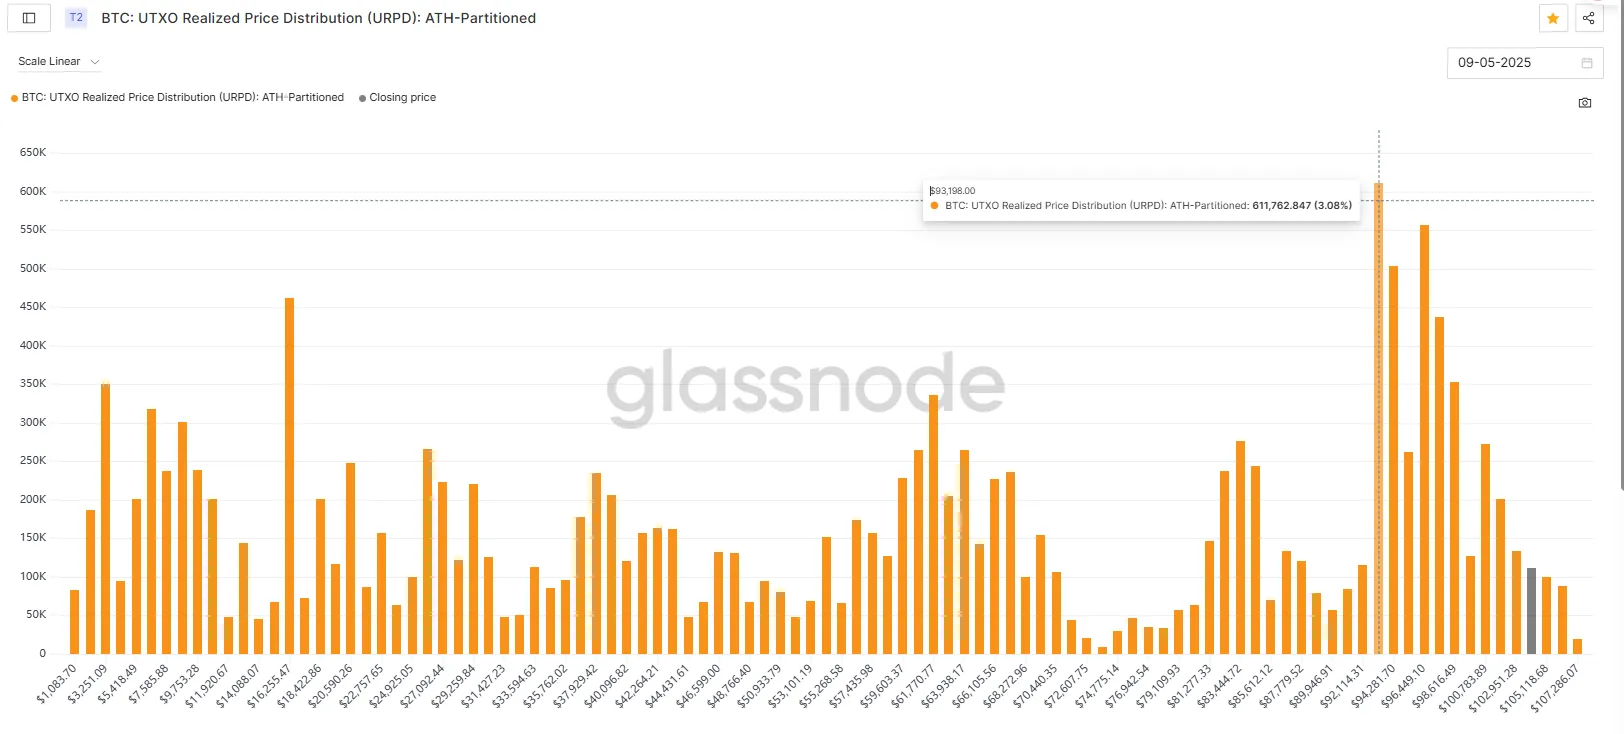
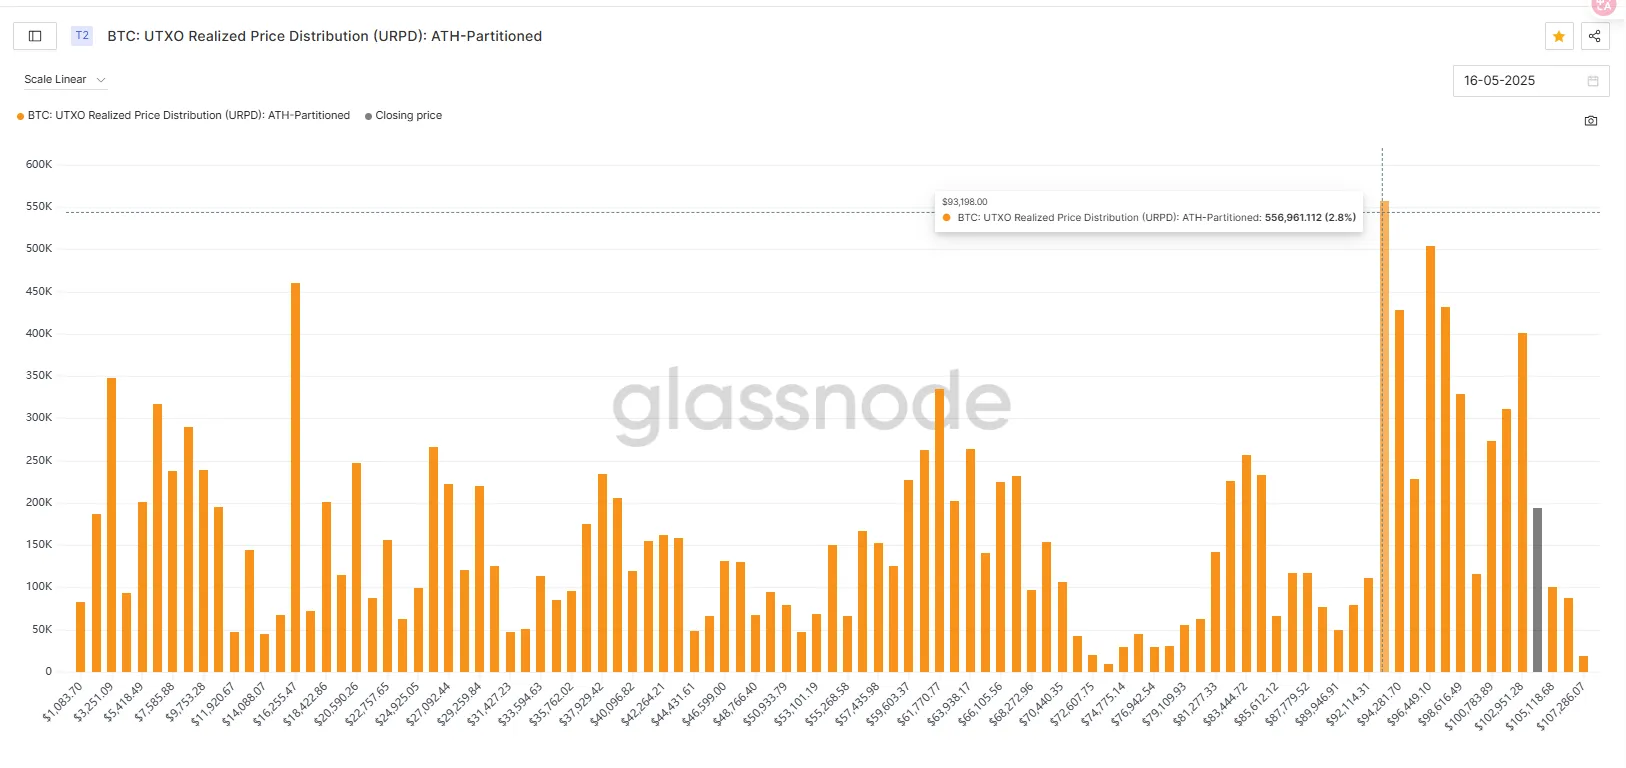
1.4 URPD
This week's on-chain data shows that the proportion of Bitcoin chips in the $101,800-104,000 range has increased by 1.72%, which means that more BTC has changed hands in large quantities at this price, and market consensus has gradually formed in this area. This accumulation of chips reflects that this range has strong support properties, and it may be protected by funds during the short-term decline. But at the same time, this location where chips are concentrated is also prone to evolve into a shock area or a short-term resistance zone, especially in the current context of continued net outflow of ETF funds and slowing issuance of stablecoins. The new buying power is insufficient and the upward price may be limited.
2. Changes in mid-term market data that affect the market this week
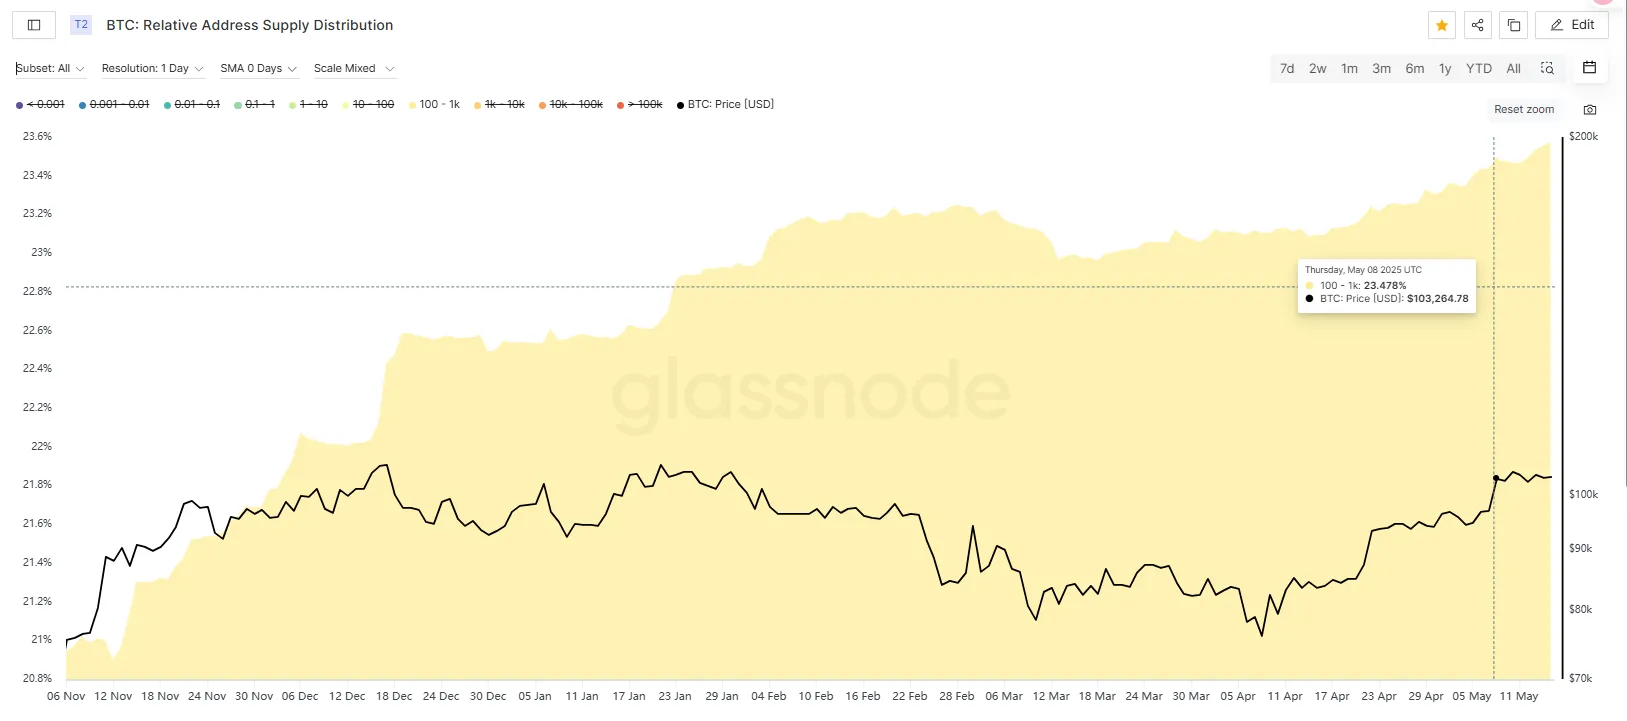
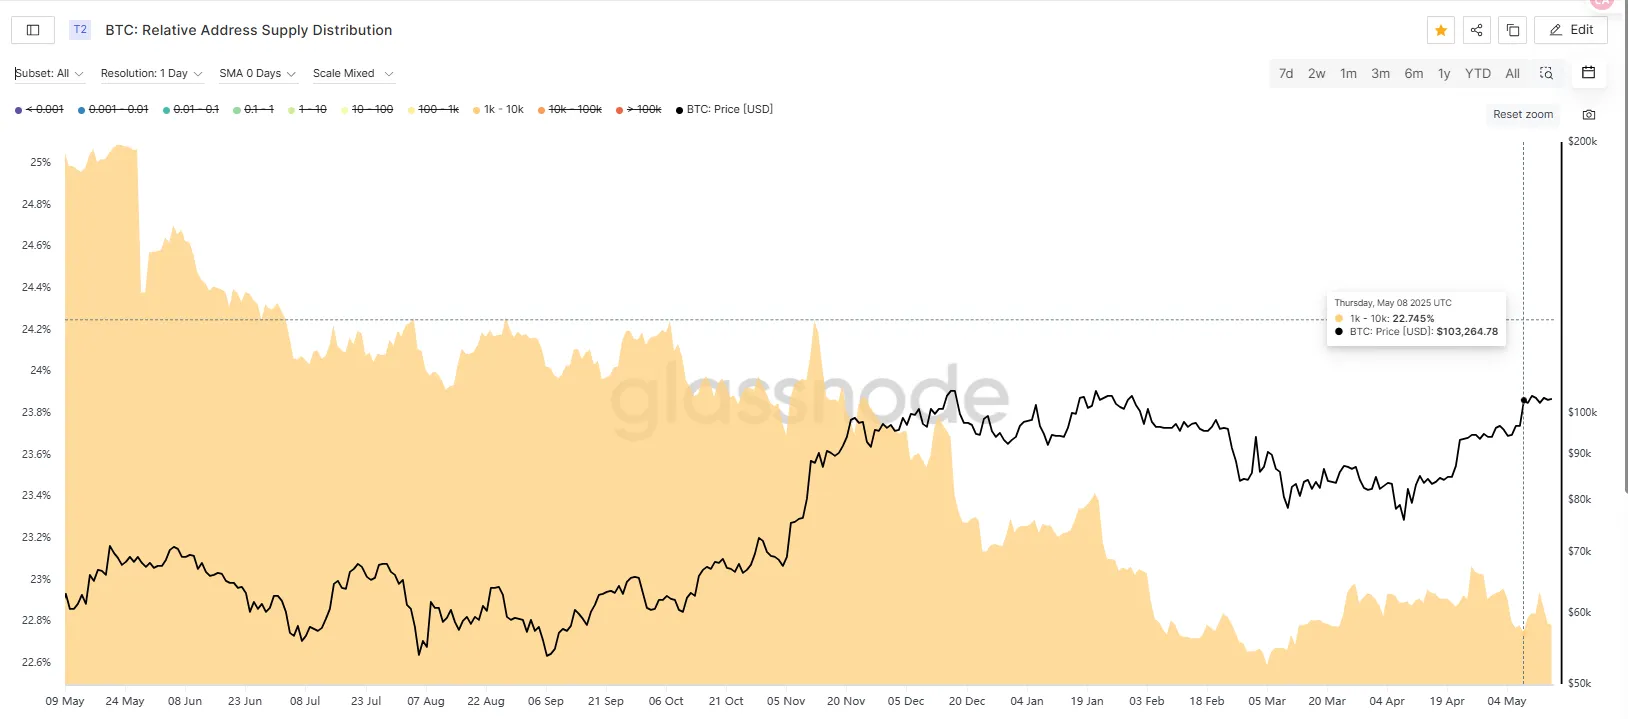
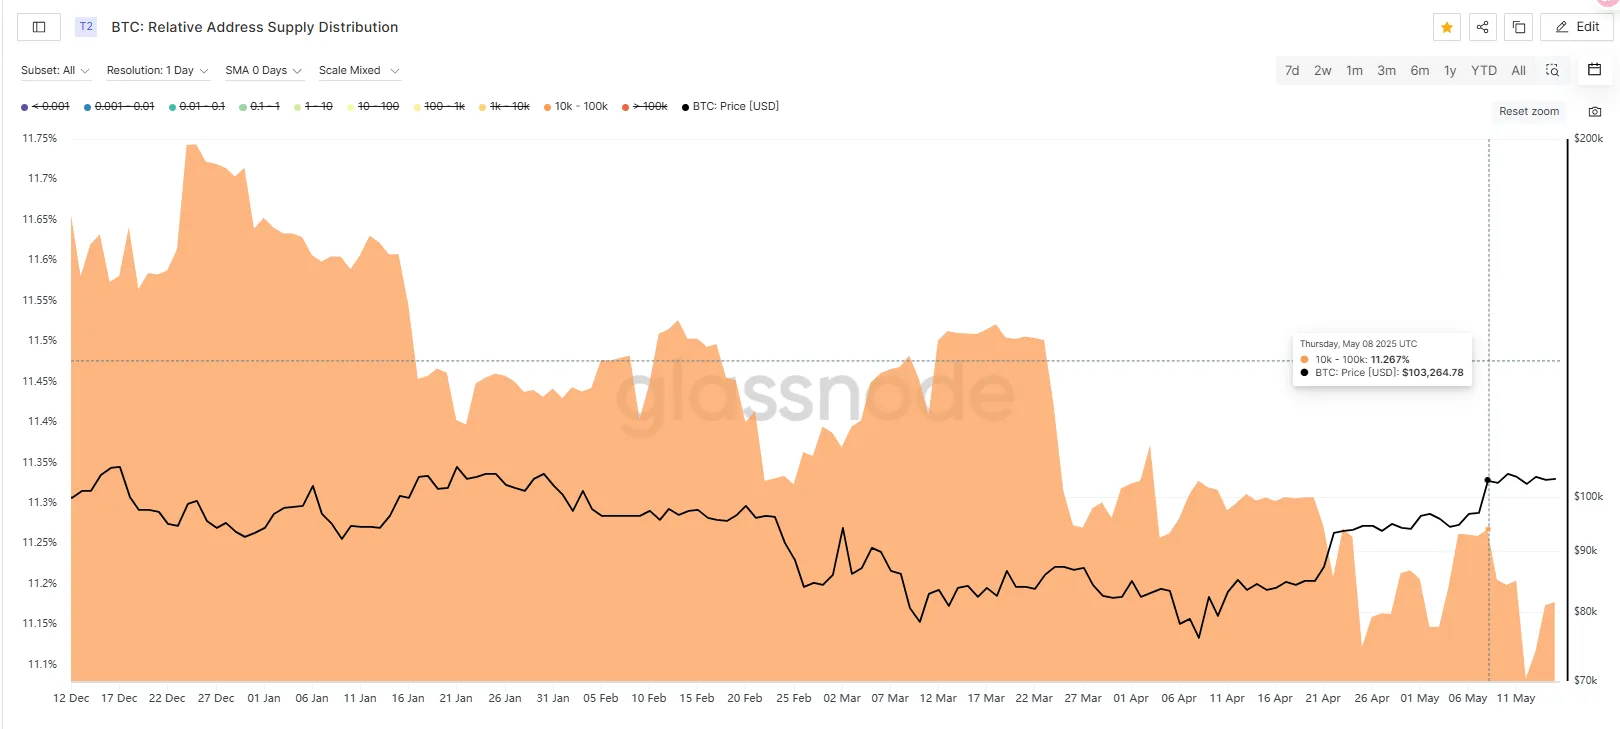
2.1 Proportion of coins held by coin holding addresses
The changes in the address structure on the chain this week show obvious capital game: large addresses of 10k-100k choose to reduce their positions when the price rises, and make up a small amount when the price falls, reflecting the strategy of short-term risk aversion and high-level position adjustment; 1k-10k addresses increase their holdings slightly during the rise, but quickly reduce their positions at the high point, showing that they are highly tradable and obviously chase ups and downs; while 100-1k addresses continue to increase their holdings steadily, without obvious reduction of positions, reflecting that small and medium-sized funds still have certain confidence in the market. Overall, the attitude of large funds tends to be cautious, while small and medium-sized funds constitute an important support for the current price range, and the market is in a wait-and-see and game stage.
2.2 Market Pattern Analysis
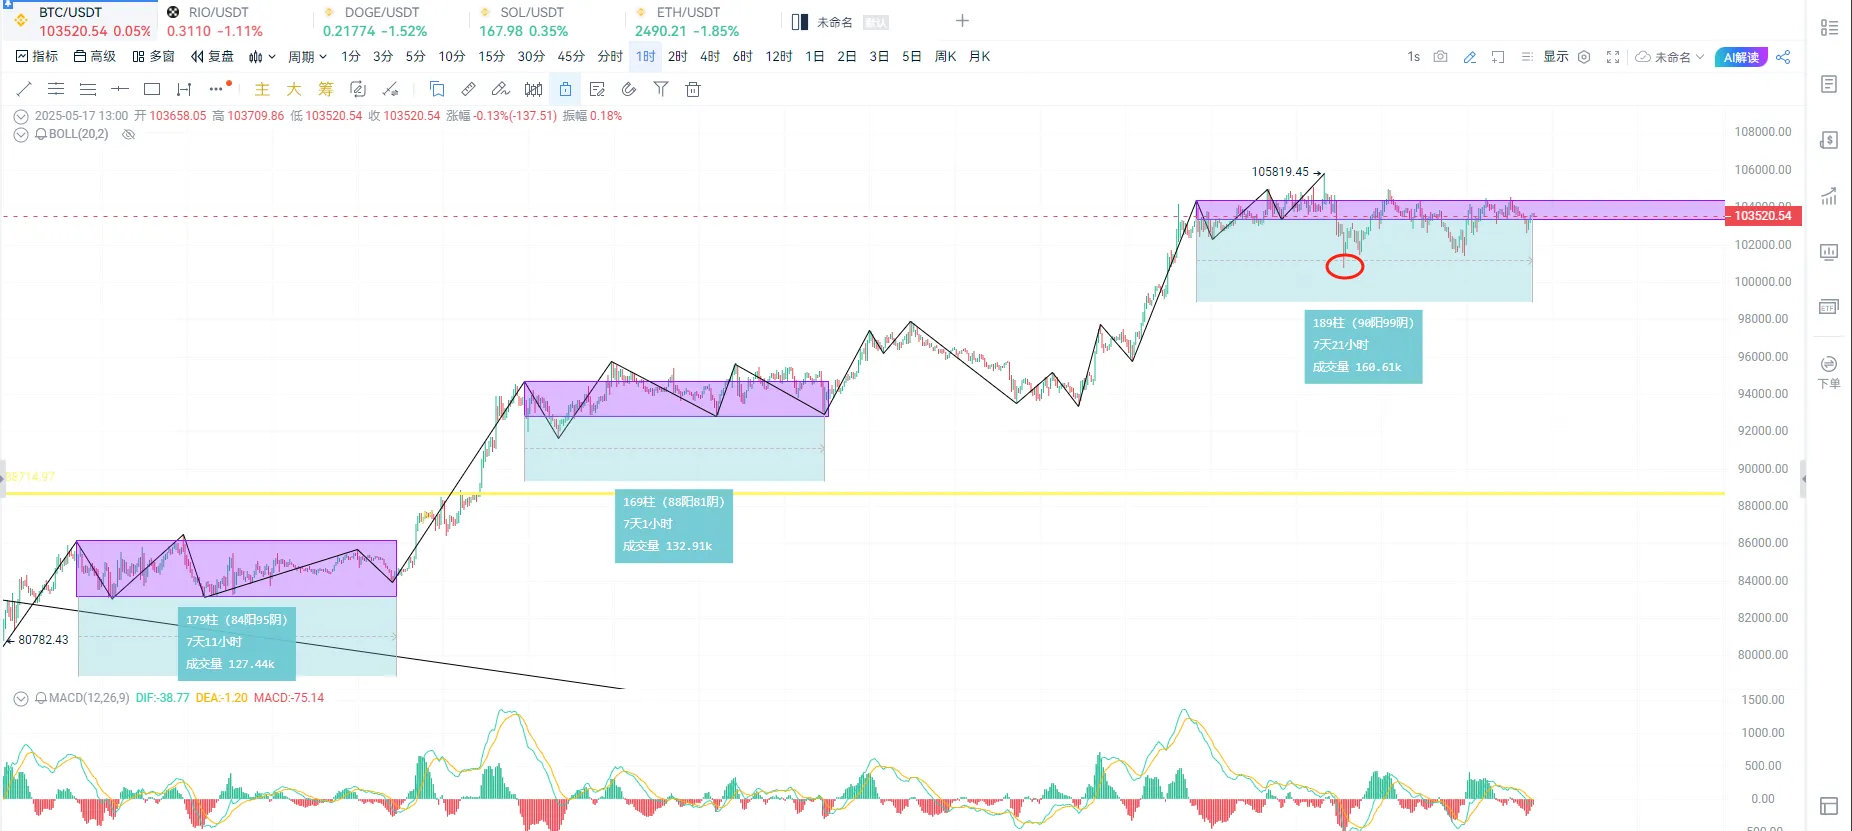
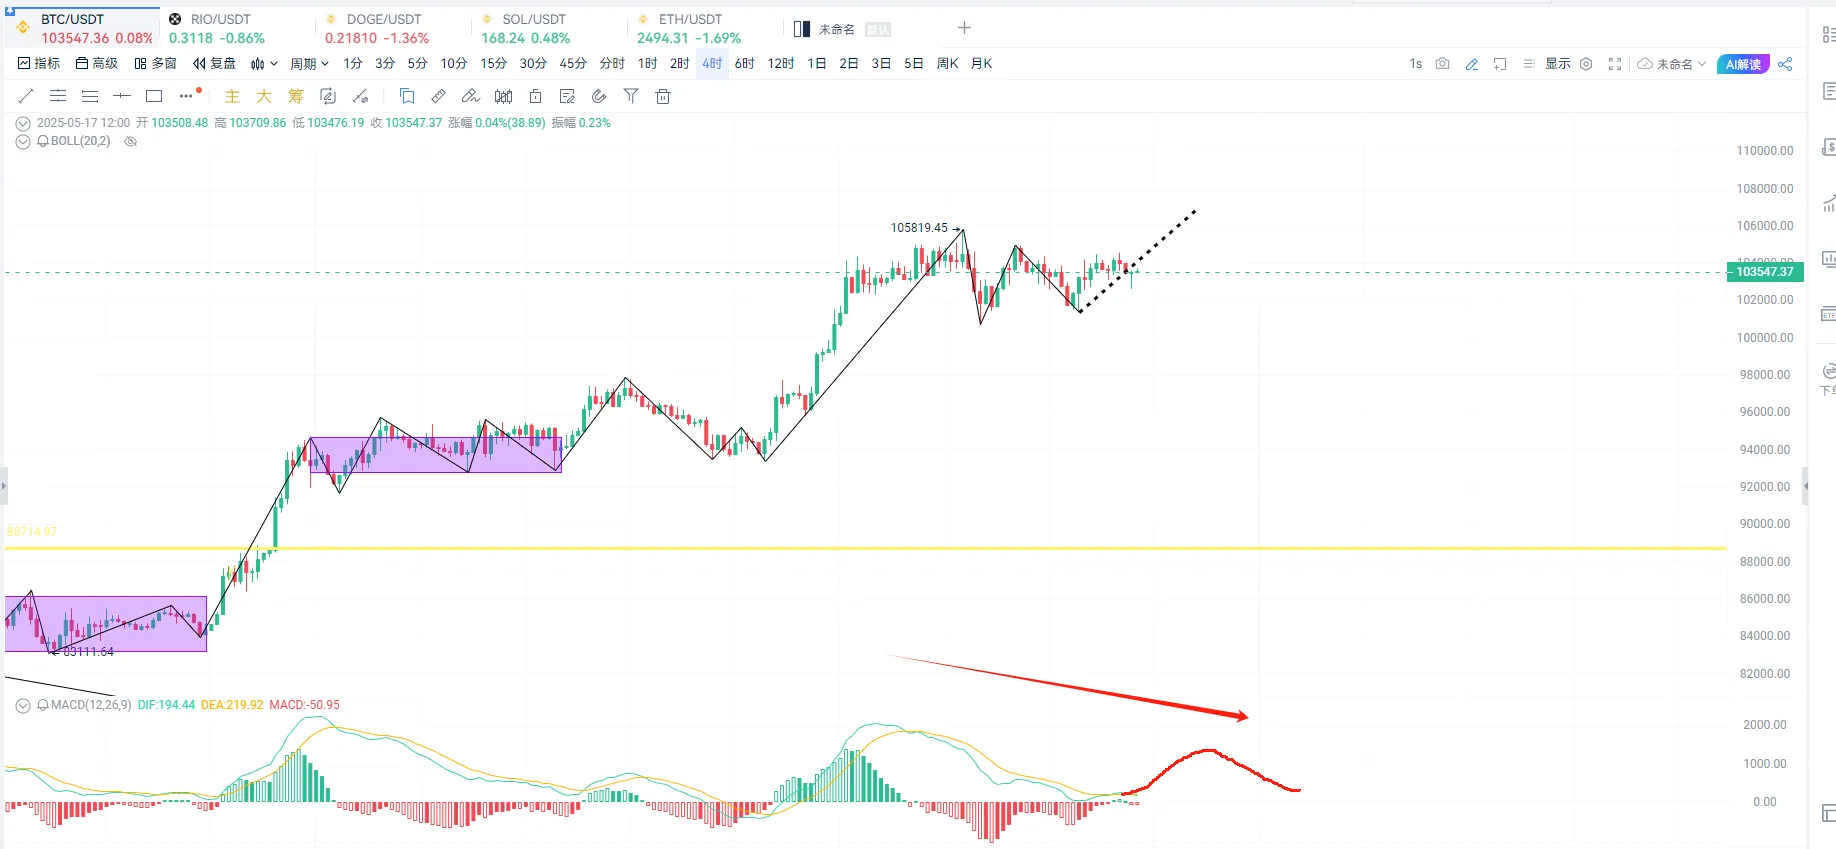
The market performance this week is consistent with the analysis last week. After rising at the 1h level, it fell back to test the support level near 10w. At present, the red circle position is the defensive position of long orders. The current trading range has been sideways for nearly 8 days, overlapping with the previous two trading ranges in time. It may be affected by the weekend and no directional choice was made. In four hours, the indicator has been repaired and there is a possibility of further upward surge. Combined with the recent divergence of capital data, if there is no major good news, there is a high probability that the momentum will be exhausted after this upward surge.
Special thanks
Creation is not easy. If you need to reprint or quote, please contact the author in advance for authorization or indicate the source. Thank you again for your support.
Written by: Sylvia / Jim / Mat / Cage / WolfDAO
Edited by: Punko / Nora
Thanks to the above partners for their outstanding contributions to this weekly report. This weekly report is published by WolfDAO for learning, communication, research or appreciation only.
