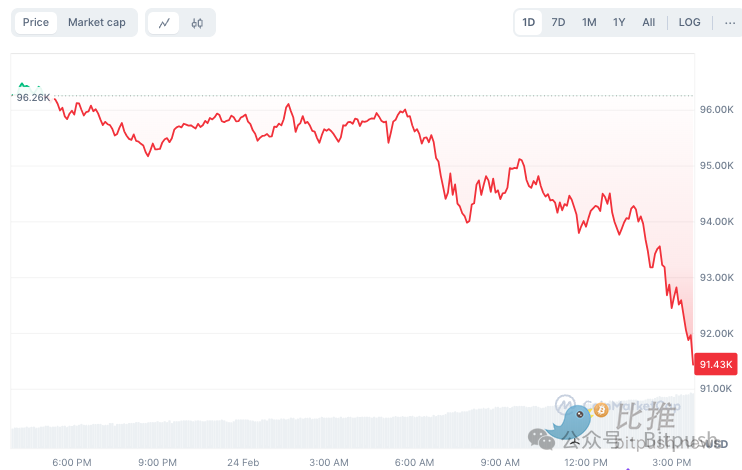
The crypto market started the week with a sharp drop. In the past 24 hours, Bitcoin fell 5%, once falling below the $91,000 mark, setting a new monthly low. Other mainstream currencies fell across the board: Solana (SOL) fell more than 16%, Ethereum and XRP fell 12%, BNB was relatively "mild", falling 6%, and more than 90% of the top 100 tokens by market value suffered losses.
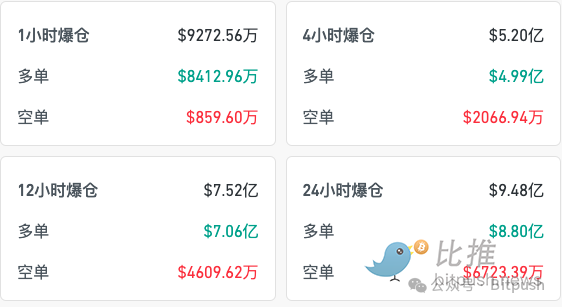
Coinglass data shows that as of press time, the 24-hour liquidation amount of the entire crypto network has reached US$950 million, mainly long orders, and a total of 314,902 people have been liquidated worldwide.
Bitcoin: 200-day moving average determines future direction
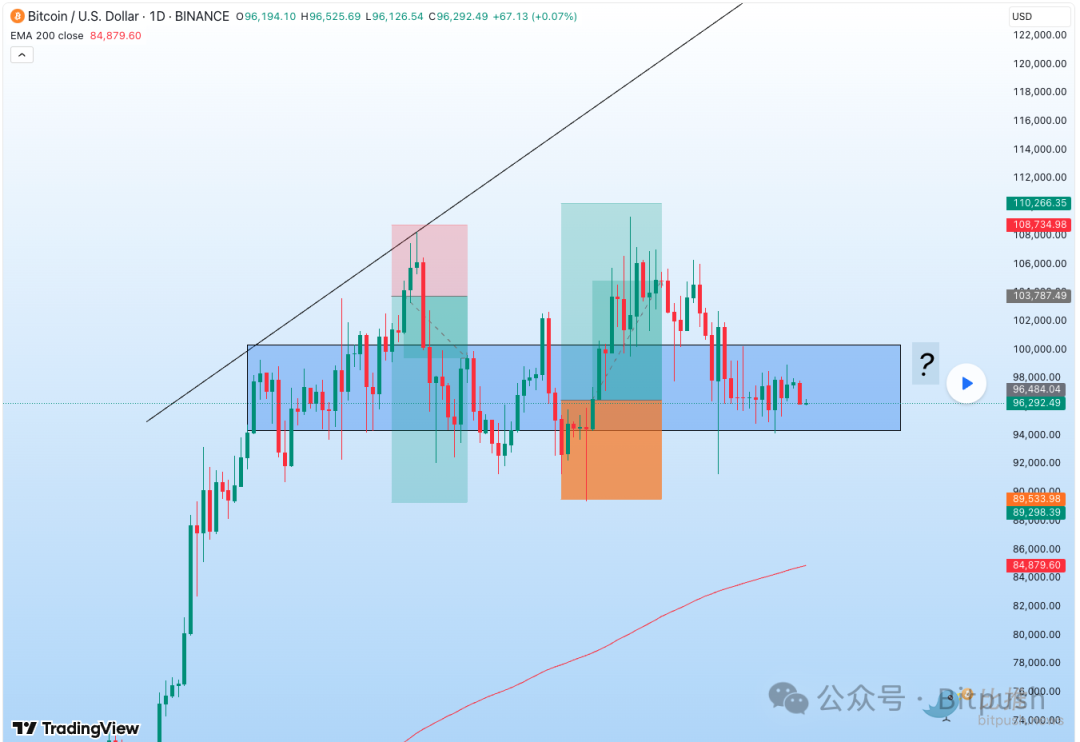
Tomarket, a chart analyst at TradingView, said that the daily chart of Bitcoin (BTC/USD) shows that the price is currently in a consolidation phase, and the fluctuation range is limited to an obvious range (the blue rectangular area in the above figure). This pattern shows that the market is in a stalemate between long and short games, and neither the buyers nor the sellers have a clear advantage.
From a technical perspective, the key resistance level is located in the $100,000 to $103,787 range, and a break above this level could start a new round of gains with targets of $108,734 to $110,266. On the other hand, the short-term support level is in the $96,484 to $97,065 range, and a break below this level could trigger more selling pressure. In the long term, the $89,533 to $84,773 area (200-day moving average) is an important support level, which has historically been a strong demand area in trending markets.
The 200-day SMA ($84,773) is a key long-term support and any pullback towards this area is likely to attract buying.
In terms of potential market trends, if the price falls below $96,000, it may indicate an increase in selling pressure, further falling to the $89,533 to $85,000 area, or even losing the 200-day moving average to trigger a deeper correction. If it breaks through $103,787, it may trigger the continuation of the upward trend, with targets at $108,734 and $110,266, and may even break through $120,000 to set a new all-time high.
In summary, Bitcoin is currently in a period of consolidation and the 200-day moving average is a key long-term support level. Traders should pay close attention to the price performance of these key areas to determine the next direction of the market.
Ethereum faces a sharp drop, market sentiment tends to be cautious
One possible reason for ETH’s poor performance is that some traders had expected Bybit to buy a large amount of ETH on the open market to make up for their losses, but this assumption turned out not to be true, forcing traders to close their positions.
Data shows that the open interest of Ethereum futures fell from 8.82 million ETH to 8.52 million ETH on February 24, indicating that traders are closing leveraged positions. Well-known cryptocurrency analyst Crypto Rover warned on Twitter that if Ethereum (ETH) continues to fall sharply, it may cause market concerns about whether the alt season can continue.
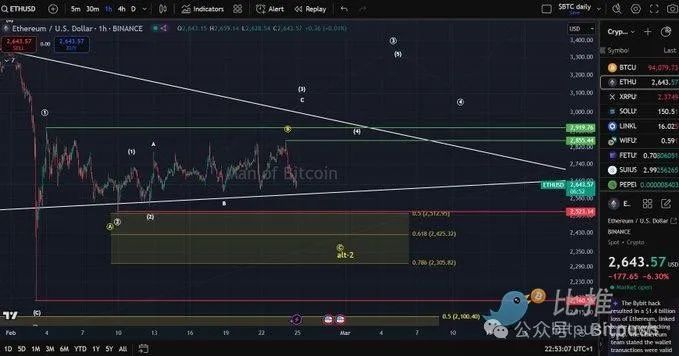
On-chain data shows that the number of active Ethereum addresses has decreased by 7% to 450,000 in the past 24 hours, and network activity may be declining. From a technical analysis point of view, the price of ETH has fallen below the 50-day moving average, showing bearish momentum. @Manofbitcoin analyzed on the X platform that the support level of ETH is between $2,512 and $2,305. Only a sustained breakthrough of $2,919 will confirm the upward trend.
In summary, Ethereum is currently facing great downward pressure, and market sentiment is becoming cautious. The subsequent impact of leverage liquidation and the Bybit incident has exacerbated price volatility. The potential decline in ETH prices may have a chain reaction on the altcoin market, and investors need to pay close attention to key support levels and changes in market sentiment.