
Author: Connor King
Compiled by: Deep Tide TechFlow
Introduction: This article tested six token value accumulation mechanisms across 159 protocols and found that revenue scale is more important than mechanism design—protocols with daily revenue exceeding $500,000 had an average return of +8%, while the lowest tier was -81%. More importantly, many seemingly "winning" mechanisms immediately reversed after removing one or two top projects, which has direct reference value for investors when choosing tokens.
We mapped six value accumulation mechanisms for 159 tokens and tested which mechanisms actually translate into rewards for token holders.
The crypto industry's narrative about the accumulation of token value is largely wrong.
Research settings
Two weeks ago, we released our "2026 Investor Relations and Token Transparency" report. One of our findings was that 38% of crypto protocols actively accumulate value, while 62% do not return any value to token holders.
This article is a supplementary analysis. We obtained a dataset of 159 protocols, categorized each token by its accumulation mechanism, and pulled 1-year price performance data from Artemis. The question is: which mechanisms actually translate into returns?
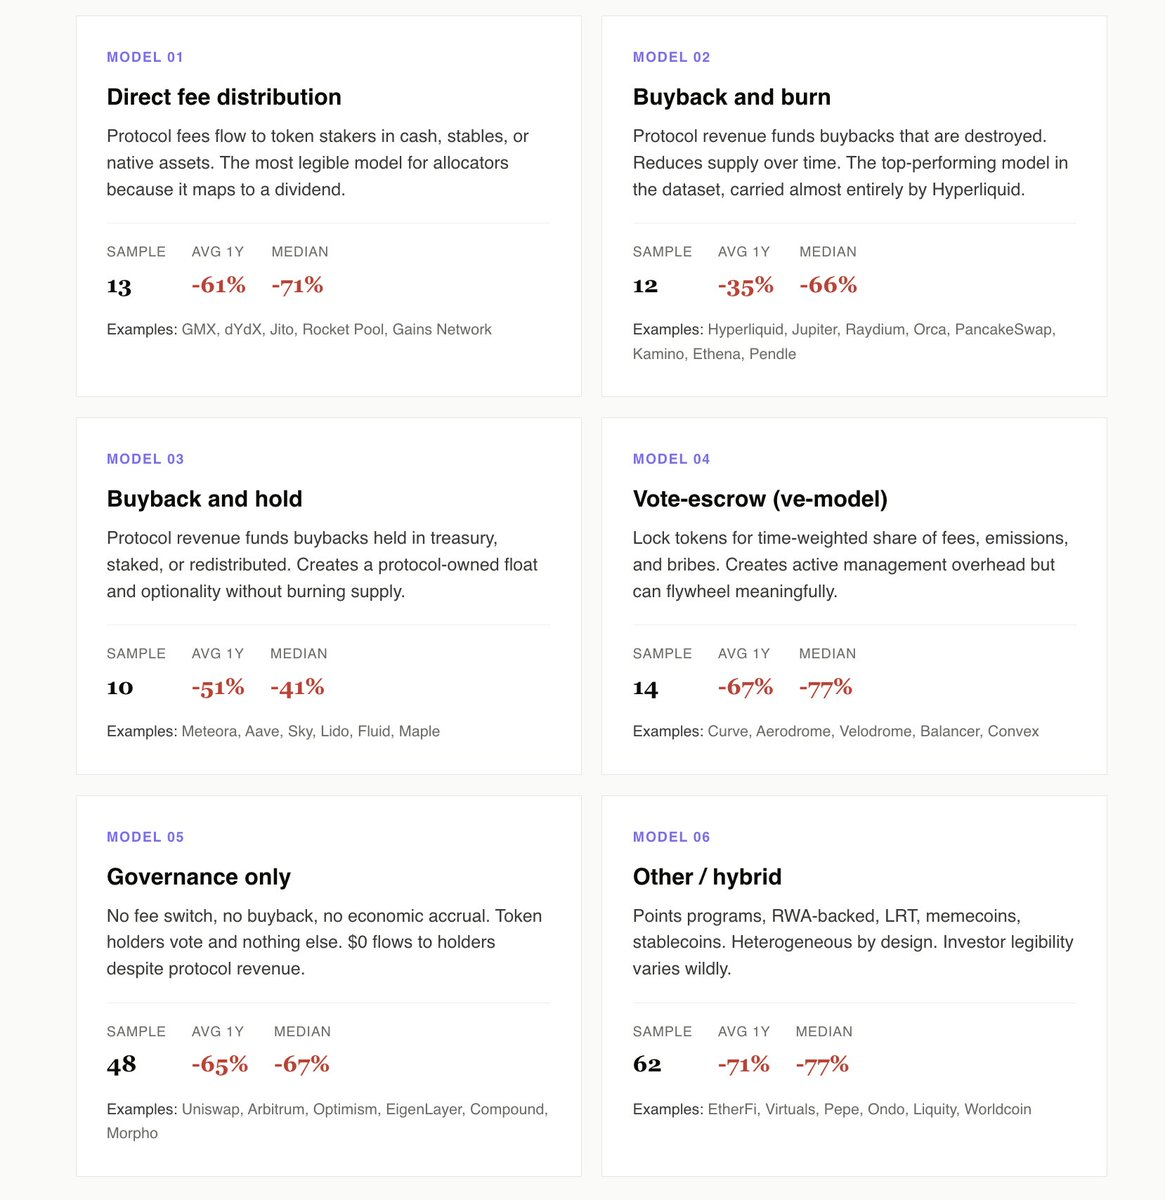
We identified six models: direct fee allocation, buyback and burn, buyback and hold, voting custody (ve model), pure governance, and other/hybrid models.
Here are our findings:
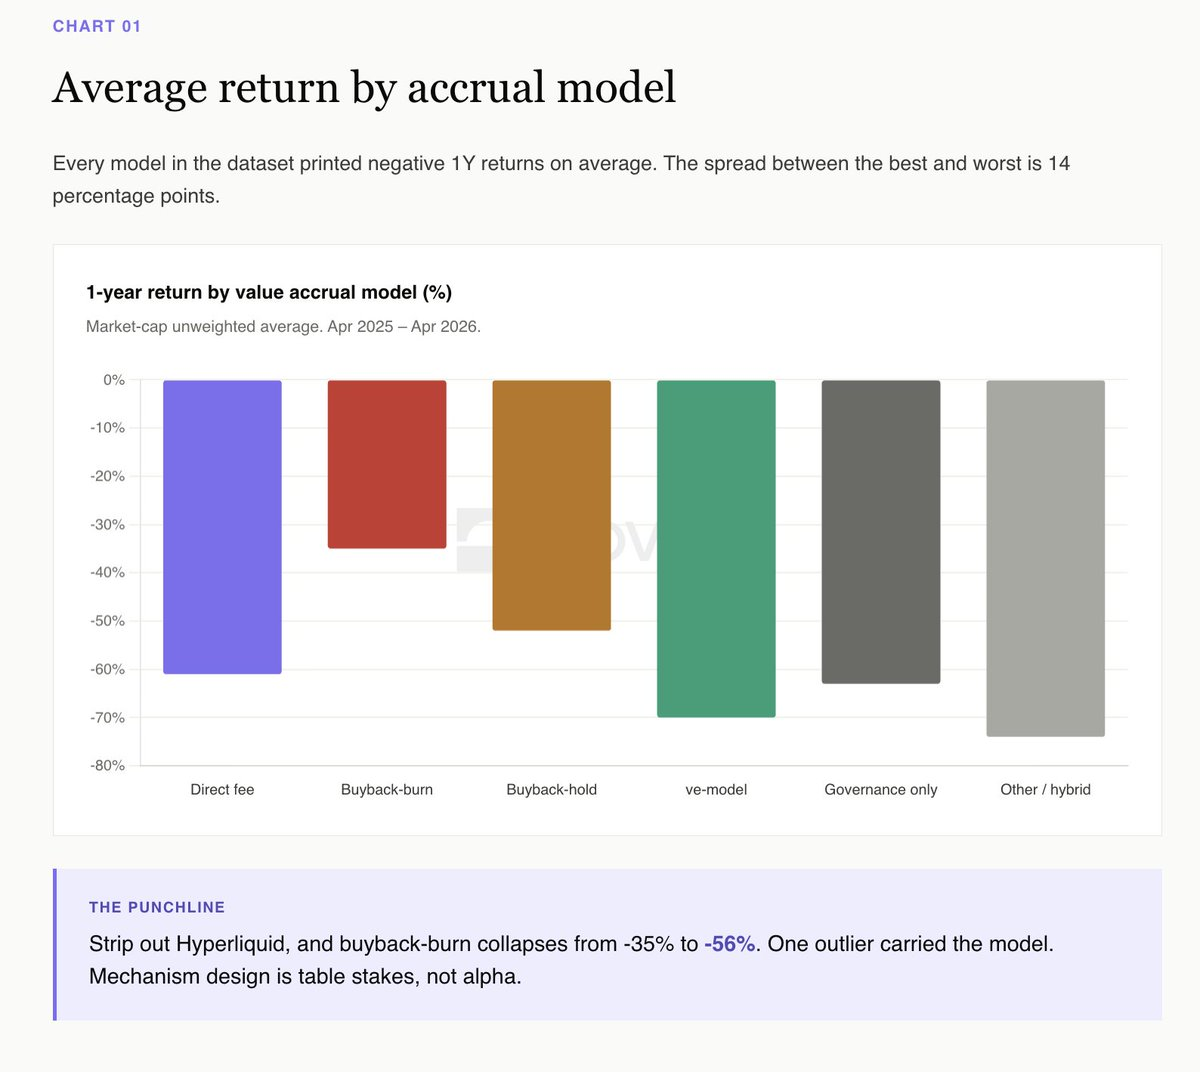
Active accumulation leads by 10 percentage points over pure governance.
The 49 protocols using direct fees, buybacks and burns, buybacks and holdings, and the Ve model have an average return of -55% over the past year. The 48 pure governance protocols have an average return of -65%.
The gap widens further when focusing on pure governance tokens that generate revenue, such as Uniswap, Arbitrum, and Morpho. These protocols generate real revenue but don't share any of it with token holders. Opportunity cost is the most striking aspect of the dataset.
Pure governance is equivalent to a listed company's investor relations strategy of neither paying dividends nor repurchasing shares. Ultimately, allocators stop pretending this is a going concern and begin pricing it as an option for management to wake up.
Hyperliquid is a buyback and burn category.
On the surface, the data shows that buybacks and burns have won this year (average -35%), while buybacks and holdings rank second (-52%). This seems to be a complete victory for burns.
But the story reverses after removing Hyperliquid. Without HYPE, buybacks and burns averaged a -56% loss, while buybacks and holdings averaged a -52% loss. One token dictates the entire category.
Meteora is the cleanest buyback holding case. A $10 million buyback program, Novora's 95/100 investor relations score, and transparent treasury accumulation. It's down about 40% this year, below the peer median. Holding buyback tokens in a transparent treasury retains the option, creating a visible, audited circulating supply. Burning destroys the option in exchange for a marketing headline.
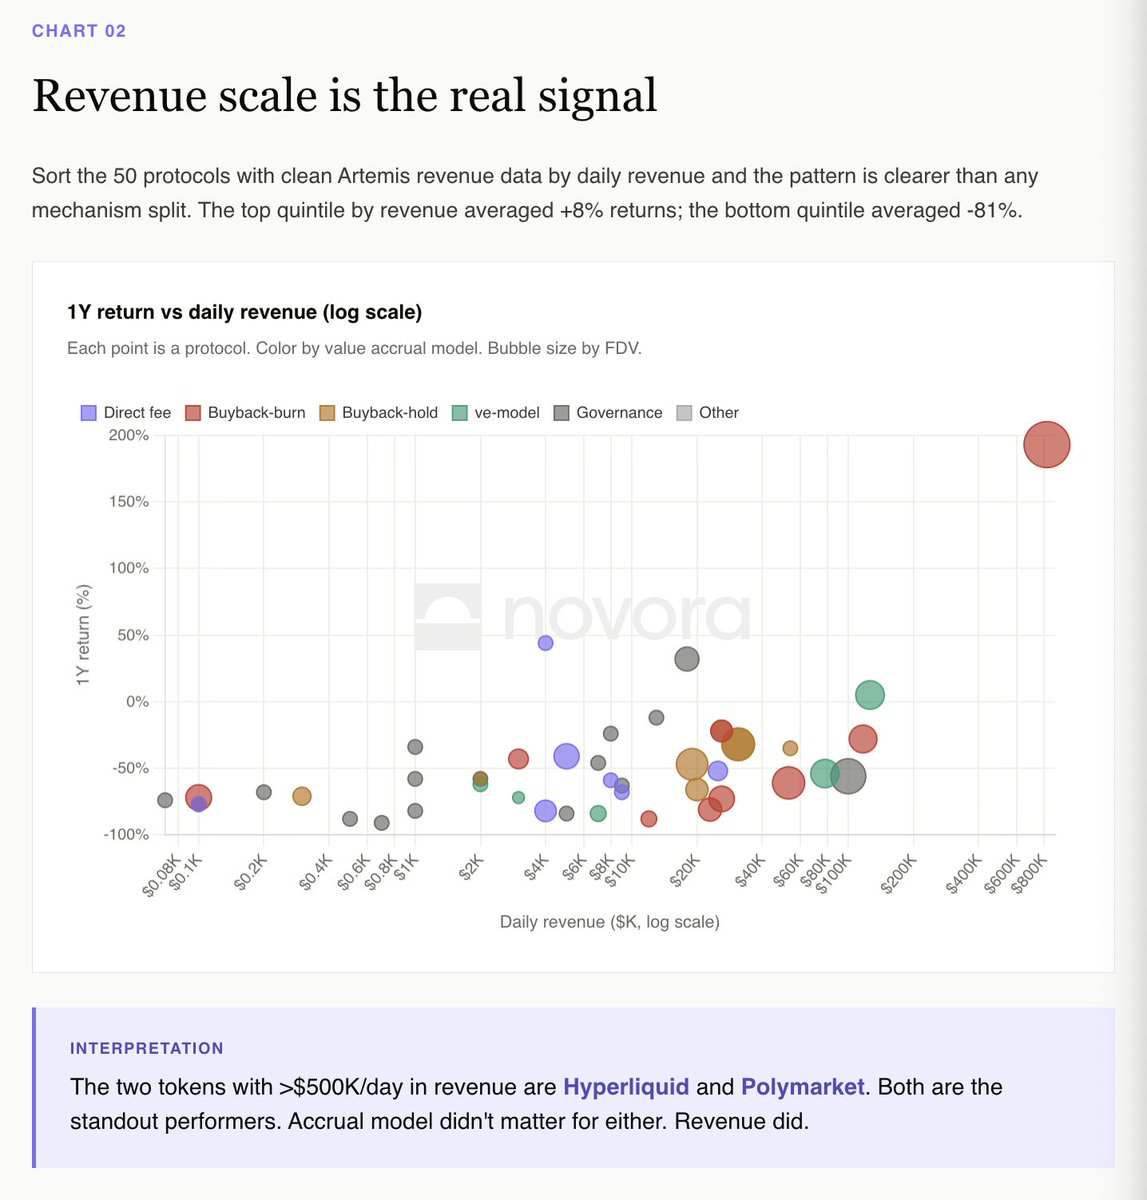
Revenue size is the real signal
Sorting 50 protocols with clear Artemis revenue data by daily revenue reveals a clearer pattern than any other categorization mechanism.
The top 15% of agreements ranked by income have an average return of +8%. The bottom 15% have an average return of -81%.
The two protocols that generate over $500,000 in daily revenue are Hyperliquid and Polymarket. Both are top performers on the dataset. Their cumulative models differ, but their revenue trajectories are similar.
dYdX Paradox vs Hyperliquid Paradox
Direct fee allocation is the most readable model for institutional allocators because it clearly maps to dividends. dYdX runs the textbook version: 100% of trading fees go to stakers, 75% of net income is repurchased, and it boasts top-notch investor relations infrastructure.
dYdX has fallen 82% in the past 12 months. The mechanism is operating exactly as promised, but the business is not.
Hyperliquid is the opposite. It uses a buyback and burn program through an aid fund (99% of the cost), has zero traditional investor relations infrastructure, and an annualized return of +193%.
If you're a strategist, this is the clearest interpretation of the dataset: you're buying a portion of the protocol's revenue, and if revenue decreases, the token price will drop. The mechanism is a basic requirement; the revenue trajectory is everything.
The ve model requires a permanent bribe to function.
Aerodrome is the only Ve model token in the dataset with a positive (+5%) 1-year return. This mechanism relies on inflows from the Base ecosystem to maintain the bribery market.
Velodrome, Curve, Balancer, and each smaller ve fork all fell between -54% and -84%. The ve flywheel works, but it requires a constant influx of new capital. When capital stops flowing in, the entire structure collapses.
This is not a criticism of the model. Rather, it is an acknowledgment that the Ve token is a leveraged bet on ecosystem inflows, and not necessarily a bet on pure protocol fundamentals.
Mixed category average -71%
Points programs, RWA, LRT, memecoin, stablecoins. 62 protocols. The most heterogeneous category in the dataset. Average 1-year return: -71%.
This is the fate of most projects launched in 2024-2025: EtherFi, Renzo, Puffer, Usual, Virtuals, AI16Z, the entire LRT queue, and the memecoin queue. These tokens rely on narratives and TGE airdrop trading, not cash flow mechanisms. Once the airdrop is unlocked, there's nothing to support the price.
Investor readability is a fundamental problem. Allocators cannot underwrite a token whose accumulation mechanism relies on a future narrative.
Panoramic view
Average 1-year return based on the cumulative model:
Buyback and burn: -35% (driven by Hyperliquid; -56% excluding HYPE)
Buyback holding: -52%
Direct cost allocation: -55%
Pure treatment: -65%
Escrow (VE model): -67%
Other/Mixed: -71%
Of the 135 protocols with empirically available performance data, 5 returned positive returns over the past year. Median return: -66%.
what does that mean
The market will not pay a premium for good mechanism design, but it will punish tokens that have no mechanism at all.
The clearest empirical interpretation in 2025 is that value accumulation did not generate excess returns, but income was. However, the data from 48 pure governance protocols demonstrates the cost of lacking a mechanism. When the market chooses between tokens that pay you and tokens that don't, it will choose the one that pays.
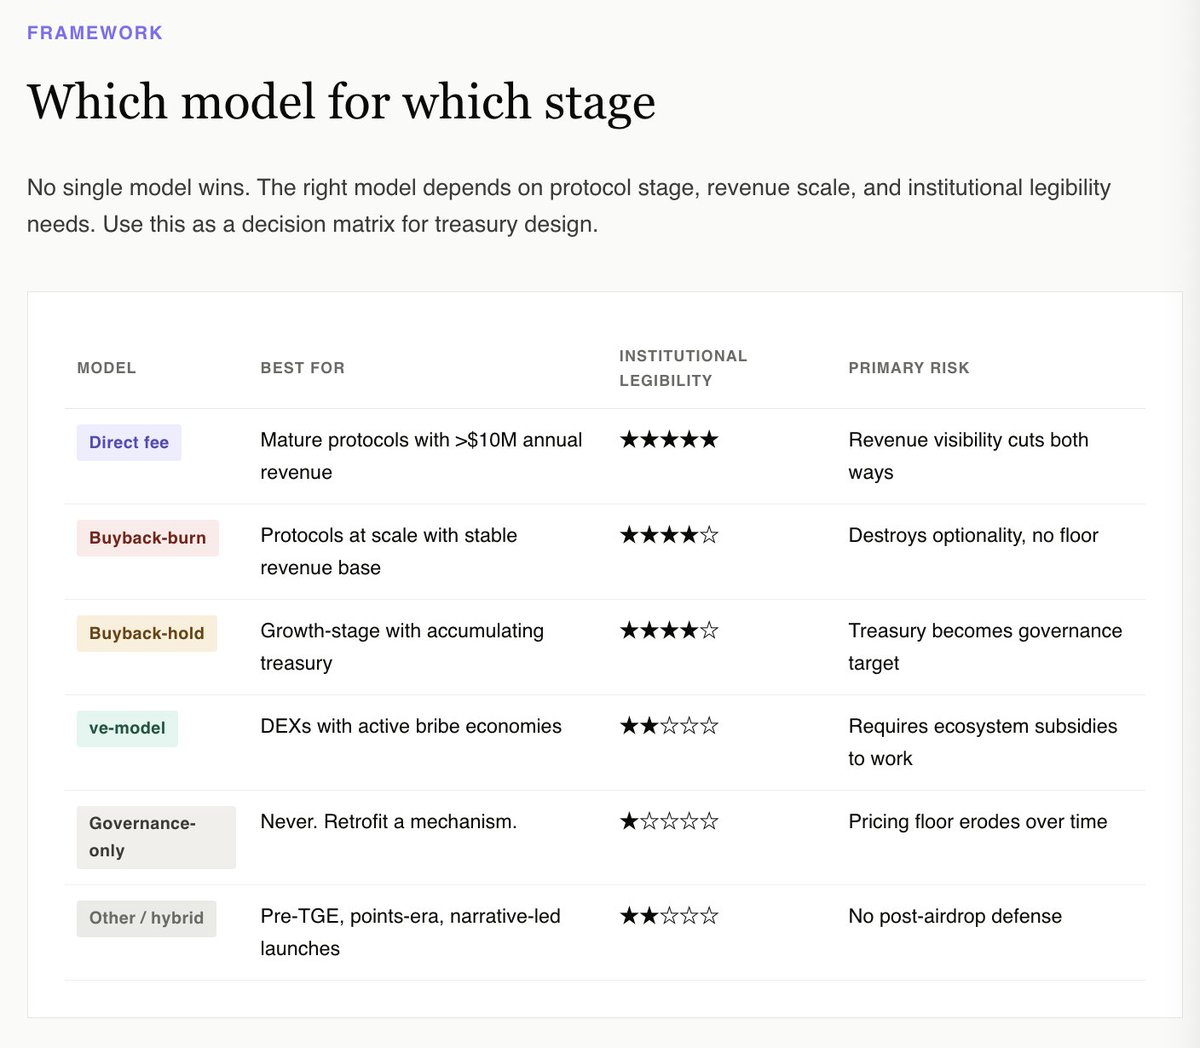
For the Treasury, the right question isn't which mechanism maximizes upside potential. Data shows none reliably does. The right question is which mechanism makes the token appear investable from an institutional allocator's fundamental perspective.
This perspective immediately excludes pure governance and hybrid categories. It favors buyback holdings with transparent treasury disclosures, buyback-and-burn protocols (Hyperliquid) for scaling protocols, direct fee distribution for mature revenue-generating protocols, and the ve model, which is tied to an active bribery market for native tokens of narrow-range DEXs.
For all other tokens, including most issued in the last 24 months, the honest answer is: revise a mechanism before the next unlock. Do it while you still have the option.
A complete interactive report containing all 159 protocols and filterable datasets is now available:
https://www.novora.co/research/value-accrual-2026.html
This article is for informational purposes only and does not constitute financial, investment, or legal advice. All data has been verified based on publicly available sources as of April 2026. Novora may have advisory relationships with any agreements mentioned in this report. Always conduct your own research and consult a qualified financial advisor before making any investment decisions.
