Author: Stephen Perrenod , Technical Analyst
Compiled by: Felix, PANews
The biggest bubbles (bull markets) in Bitcoin's history occurred in 2011, 2013, 2017, and 2021. Although many Bitcoin investors firmly believe in a four-year cycle, no bubble has materialized in 2025.
Why? Because everyone has been brainwashed by the narrative that "bubbles occur linearly every four years," expecting peaks to occur after the four halving years of 2012, 2016, 2020, and 2024. This narrative is further reinforced by the US business cycle and presidential election years.
I myself was once deeply caught up in the assumption of a four-year linear cycle.
Over the past year, I have become increasingly focused on modeling bubbles, analyzing the "core power-law zone" (long-term trend) and the "bubble zone" (short-term deviation) separately.
The results are becoming increasingly clear: the "energy" of the bubble is decaying, roughly inversely proportional to the "age" of Bitcoin, or decaying to the power of -0.83 of its age.
People mistakenly believe that the percentage increase of each bubble will be the same, but in fact, the strength of bubbles is clearly decreasing. This study also shows that the time intervals between bubbles are lengthening.
What about the 2011 bubble? People tend to ignore the huge bubble of 2011 as an "early anomaly." But the 2011 bubble was actually just as important as those of 2013 and 2017 and should be treated equally. What if bubbles didn't appear in linear cycles, but rather in logarithmic cycles? This phenomenon is called logarithmic cyclical behavior.
Log-cyclic bubbles originate from power laws
After all, Bitcoin is a power-law asset, meaning its price movement over time exhibits scale invariance. For the price to increase at the same rate, the time frame must also increase proportionally. For example, if the relationship between price and age is Price ~ Age^k, then in US dollars, if k = 5.7, the price will increase 52 times when the age doubles. To achieve the same 52-fold price increase, Bitcoin's age would need to grow from 2 years to 4 years, then from 4 years to 8 years, then from 8 years to 16 years, and so on.
Therefore, it is not surprising that the intervals between bubbles are getting longer. A logarithmic time interval may correspond to only one major bubble, while the intervals in linear time will become increasingly longer.
In fact, as early as 2019, Giovanni Santostasi (the person who discovered the power-law property of Bitcoin before the second halving) proposed a logarithmic cycle model around the power-law trend (the curved/oscillating line in Figure 1). It almost corresponds to the three bubbles in 2011, 2013, and 2017, and even predicts that the next bubble peak will be at x=3.817 (i.e., 10^3.817 ≈ 6561 days, about 18 years), which is from the end of 2026 to the beginning of 2027 .
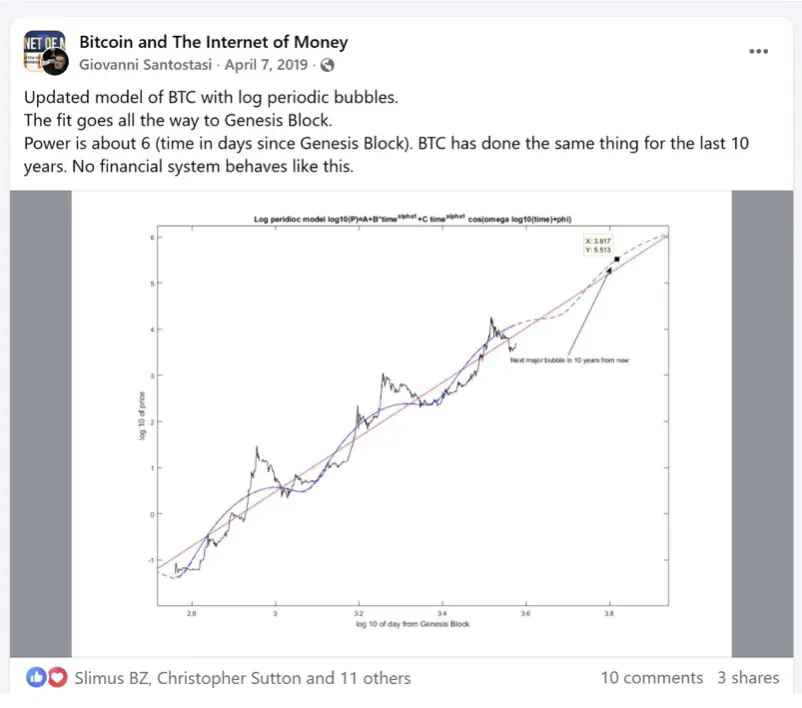
Figure 1
This post from six years ago should have received more likes. Although the amplitude fitting is average, the timing is very accurate. We will see later that the prediction of the fourth peak may be extremely accurate.
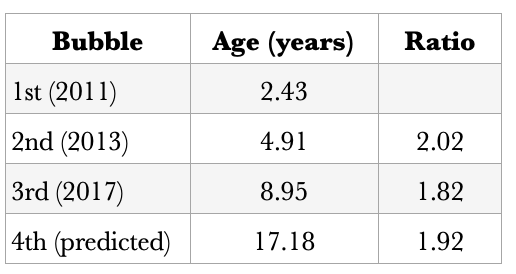
Roughly observing the age ratios, the ratios between the first two adjacent large bubbles were 2.02 and 1.82, respectively, averaging 1.92. The fourth bubble is expected to occur around age 17.18 (early 2026). Of course, this is just a rough preliminary guess .
Neither Giovanni's fitted model nor my own model, which added six and a half years of data, predicted a bubble in 2021 or 2025. This raises the question: was the double bubble in 2021 a fundamental bubble or a bubble caused by other factors?
Complete log-periodic analysis
It is important to note that the full log-periodic algorithm is far more accurate than simply using the interval between two peaks for analysis.
It relates to a more complex log-periodic analysis popularized by geophysicist Didier Sornette, which was originally used for earthquakes, other natural phenomena, and financial time series. The complete equation contains seven parameters, including a local power law index and a harmonic (cosine) term with log-time dependence.
This paper presents Fourier and wavelet analyses of the logarithmic time of the complete price history. Scale invariance tests were performed using Bitcoin measured in gold ounces. In the logarithmic price residuals at base 10, the power-law exponent is 5.30, R² is 0.94, and the standard deviation is 0.314.
Log-time Fourier transform analysis of the compressed residuals after removing the 5.30 power law yielded a log-periodic characteristic wavelength parameter λ = 2.07. In the aforementioned peak interval formula, this roughly corresponds to the ratio of the "age" of each bubble, but it is a more global estimate that also considers harmonics. Wavelet analysis revealed that λ ranges from 2.00 to 2.10.
The final optimal fit λ value corresponds to the fundamental mode, which fits the bubbles of 2011, 2013, and 2017 very well. It also predicts that the first fundamental mode bubble after 2017 will occur in 18.4 years, i.e., late May 2027. If we take the lower bound of wavelet analysis λ=2.0, the predicted age is 17.9 years, which is approximately one year from now (end of 2026), very close to Giovanni's prediction in 2019.
"The discrete age ratio model and your LPPL fit describe the same underlying discrete scale invariance (λ≈2), only in different coordinate systems; once you factor in ln(t_c − t) with age t, noise, and half-harmonics, they are completely consistent, both pointing to the fourth fundamental mode bubble appearing around 2026–2027, with the LPPL model biased slightly later (around 2027), and the coarse age ratio method biased slightly earlier (around 2026)." — GPT5
What was the bubble of 2021?
Within this framework, 2021 is not the fundamental mode, but rather the first harmonic of the fundamental mode (higher frequency, but shorter wavelength, because in the LPPL model, the angular frequency of logarithmic periodic behavior satisfies λ = e^{2π/ω}). This corresponds to the square root of 2.07, or 1.44. 8.95 × 1.44 = 12.89 years, which corresponds exactly to the end of 2021, highly consistent with the actual age of 12.85 years during the double-top bubble.
What about 2025? The logarithmic cyclical series doesn't predict a bubble. Bitcoin's weak performance relative to gold this year aligns perfectly with this framework's expectations.
Figure 2 shows the complete mapping between the fundamental frequency and half-harmonic (first harmonic in frequency, half-harmonic in wavelength) modes. The red vertical line represents the bubble peak of the fundamental frequency mode, and the blue line represents the half-harmonic. The three red lines match very well, but the blue line also reflects the smaller bubble of this harmonic well. This is not a complete mapping; there are higher harmonics, but their contribution is smaller.
The fourth red line corresponds to a prediction of 18.4 years, indicating the next major Bitcoin bubble relative to gold. Bitcoin may begin its upward trend in gold terms from the beginning of 2026, peaking in the second quarter of 2027.
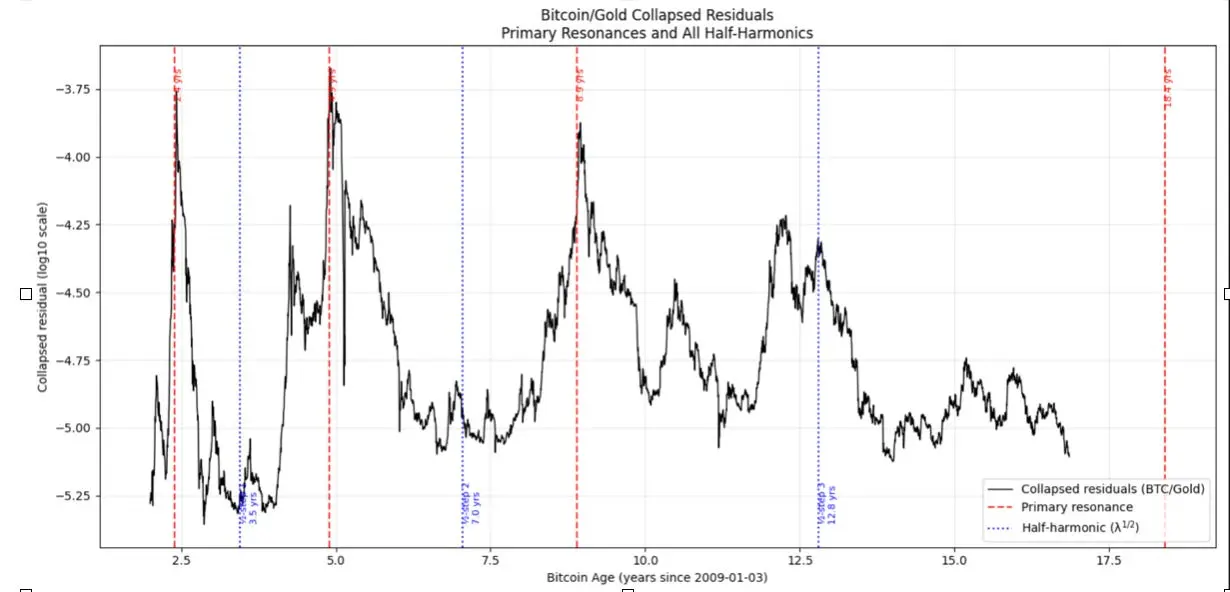
Figure 2
Why does this behavior occur? It's due to the combination of continuous scale invariance and discrete scale invariance.
To understand Bitcoin's price movements, one must understand both continuous-scale invariance and discrete-scale invariance. Continuous-scale invariance corresponds to the long-term power-law trend that readers are already familiar with. Discrete-scale invariance corresponds to intermittent bubbles, which can be described using the LPPL (log-periodic power-law) model. The name contains "log-periodic power-law," which can be confusing.
The LPPL model is applicable to short- to medium-term financial series, and in this case, it is specifically designed to simulate large fluctuations that deviate from the core power-law trend. Therefore, there are two scenarios: the overall power-law trend (continuous) and the high-volatility deviations that occur above it (discrete).
In the long run, Bitcoin adoption follows the Metcalfe law and grows exponentially.
The bubble was created by a surge of participation as new participants became interested when Bitcoin's price broke through new orders of magnitude (Bitcoin's price has risen by more than seven orders of magnitude, or seven times, in its short but influential history).
Bitcoin will only be adopted when it can change your (or an institution's) destiny.
In the early days, when prices were low, it primarily attracted cypherpunk enthusiasts, retail traders, and investors. Over time, it has attracted increasingly higher-level institutional capital: first miners, then exchanges and futures traders, then some listed companies, and now sovereign wealth funds, ETFs, and other institutional instruments. Currently, institutional capital is a net buyer, and most of their holdings are held in custody for a large number of clients and shareholders.
When Bitcoin's price and market capitalization are high enough, pension funds, sovereign wealth funds, and even national treasuries are tempted to invest. Each subsequent bubble is significantly higher than the previous one in gold ounce terms (and even higher in fiat currency terms), resulting in a massive influx of new capital adopting Bitcoin on a large scale.
Even with a market capitalization of $2 trillion, Bitcoin is still too cheap for large corporations and the treasuries of medium-sized and large countries to have a significant impact. Even if they could buy 1 million Bitcoins for around $100 billion, it wouldn't "change their fate."
Bitcoin's power-law effect is driving an ever-growing number of participants into the market. This effect stems from its protocol itself: attracting computing power, enhancing security, and providing first-mover advantage, all of which inevitably drive up prices.
Therefore, fiat currency is incentivized to flow into Bitcoin, and even fiat currency that might have flowed into gold is now flowing into Bitcoin instead. While it's true that Bitcoin's performance relative to gold was relatively weak in 2025, based on the above analysis, this could very well be a low point for Bitcoin relative to gold .
A new wave of adoption by larger players is arriving in the form of an LPPL bubble, meaning it must collapse at its local critical point. Therefore, the price trajectory will revert to a long-term power law.
Since the power law relationship is P ~ T^k, where k is the exponent and T is the age, and its first derivative is δP / P ~ k/T, the spacing between bubbles is expected to be logarithmic. The relative growth rate decreases with the reciprocal of Bitcoin's age, but the formation of a bubble requires δP / P >> k/T. By definition, a bubble forms when the price growth rate is much higher than the long-term power law trend.
This expression can be rewritten as δ (log P) ~ k * δ (log T), so it can be expected that large fluctuations in logarithmic prices (larger multiplication ratios) require increasingly longer linear time, that is, they require logarithmic time to increase proportionally by an order of magnitude of the 1/k root of the required multiplicative fluctuations.
In fact, based on gold prices, the median peak of the bubbles in 2011, 2013, and 2017 was 10.1 times the power-law trend, with a power-law exponent of 5.31. The estimated λ is approximately 10.1^(1/5.31) = 1.55, which is about three-quarters of the 2.07 value obtained by fitting the logarithmic period of the peak time. Therefore, empirically, when calculated using gold prices, λ ~ (4/3) F^(1/k), where F is the typical ratio of the peak to the power-law trend price.
Summarize
Bitcoin's main price movements consist of the following two aspects:
- The invariance of continuous scale can be represented by a power law, with an index of approximately 5.3 in gold terms and approximately 5.7 in US dollar terms.
- Discrete-scale invariance (DSI) is evident in intermittent bubble events because Bitcoin only attracts larger tiers of new capital when prices and market capitalization reach levels sufficient to attract new capital and where regulatory conditions permit. These DSI events can be described using the LPPL model to depict bubbles and their subsequent collapses.
The 2013 bubble was primarily driven by retail investors, early miners, early Bitcoin startups, and first-generation exchanges. The 2017 bubble attracted hedge funds, family offices, and other high-net-worth individuals, while GBTC trading had already begun in 2015. The bubble peaked after the launch of CME futures in December 2017, enabling efficient short selling and hedging. The 2021 bubble gained traction with some corporate finance departments and small government agencies. Increased institutional participation and related mechanisms led to stronger hedging and short selling capabilities, ultimately causing the bubble to burst and prices to revert to a power-law trend.
The next wave of mass adoption is likely to occur in 2026 and 2027, when Bitcoin's market capitalization is expected to approach $5 trillion, attracting long-term allocations from large corporations, sovereign wealth funds, and governments (national pension funds and national treasuries) . Bitcoin's cyclical bubbles reflect different tiers of global capital: from retail investors to funds, then to corporations, and finally to sovereign nations, leading to DSI behavior and a decrease in volatility associated with increased market capitalization and institutional participation.
“Each tier of capital will only be unlocked when Bitcoin is large enough, liquid enough, and trustworthy enough— a process that takes increasingly longer due to its power-law-increasing yields and k/t decay. ” — ChatGPT 5
The fundamental mode wavelength parameter λ of DSI is 2.07 (logarithmic time), roughly twice the bubble interval. The 2017 bubble was the last fundamental mode, 2021 was the first harmonic, and no bubble is expected in 2025 within this framework. The next Bitcoin peak, denominated in gold, is expected to occur between Q4 2026 (wavelet analysis minimum) and Q2 2027 (Fourier analysis value).
Related reading: Bull or Bear? 5 Signals Dominating a New Bitcoin Cycle