
By ChandlerZ, Foresight News
On May 22, 2025, the price of Bitcoin surged to over 110,000 USDT, breaking the historical high of 109,599 USDT on January 20. This scene reminds me of the episode in November 2021. At that time, Bitcoin quickly fell back after briefly crossing the high point at the beginning of the year, and a long and profound bear market cycle began. Now the market seems to have been pushed to the turning point of destiny again: will it break through again and open up a new round of rising space, or will it repeat itself like history, fall into a double top market after a "false breakthrough", and finally usher in a deep correction?
This is a question that Bitcoin cannot avoid whenever it approaches its historical high. In the past few rounds of bull markets, we have repeatedly seen similar structures: the climax is coming, market sentiment is excited, and discussions about "whether the cycle has reached its peak" are coming one after another. In this round, although the rise and rhythm are vaguely familiar, the deeper market structure has changed significantly.
Prices are repeating themselves, but the market is no longer what it was yesterday. In this context, should we continue to believe that the "cyclical law" brought about by halving will still dominate the fate of Bitcoin? Or should we admit that a new rhythm has quietly unfolded in ETF funds, on-chain structures and macro narratives?
Back to the most essential observation method, perhaps the data on the chain, the mirror image of history, and the traces of behavior can still provide us with some kind of cyclical enlightenment. Is the current wave of rise the final sprint of cyclical inertia, or a new starting point after the reconstruction of the cyclical structure? Perhaps the answer is hidden in the context of the data.
Is the market repeating its historical path?
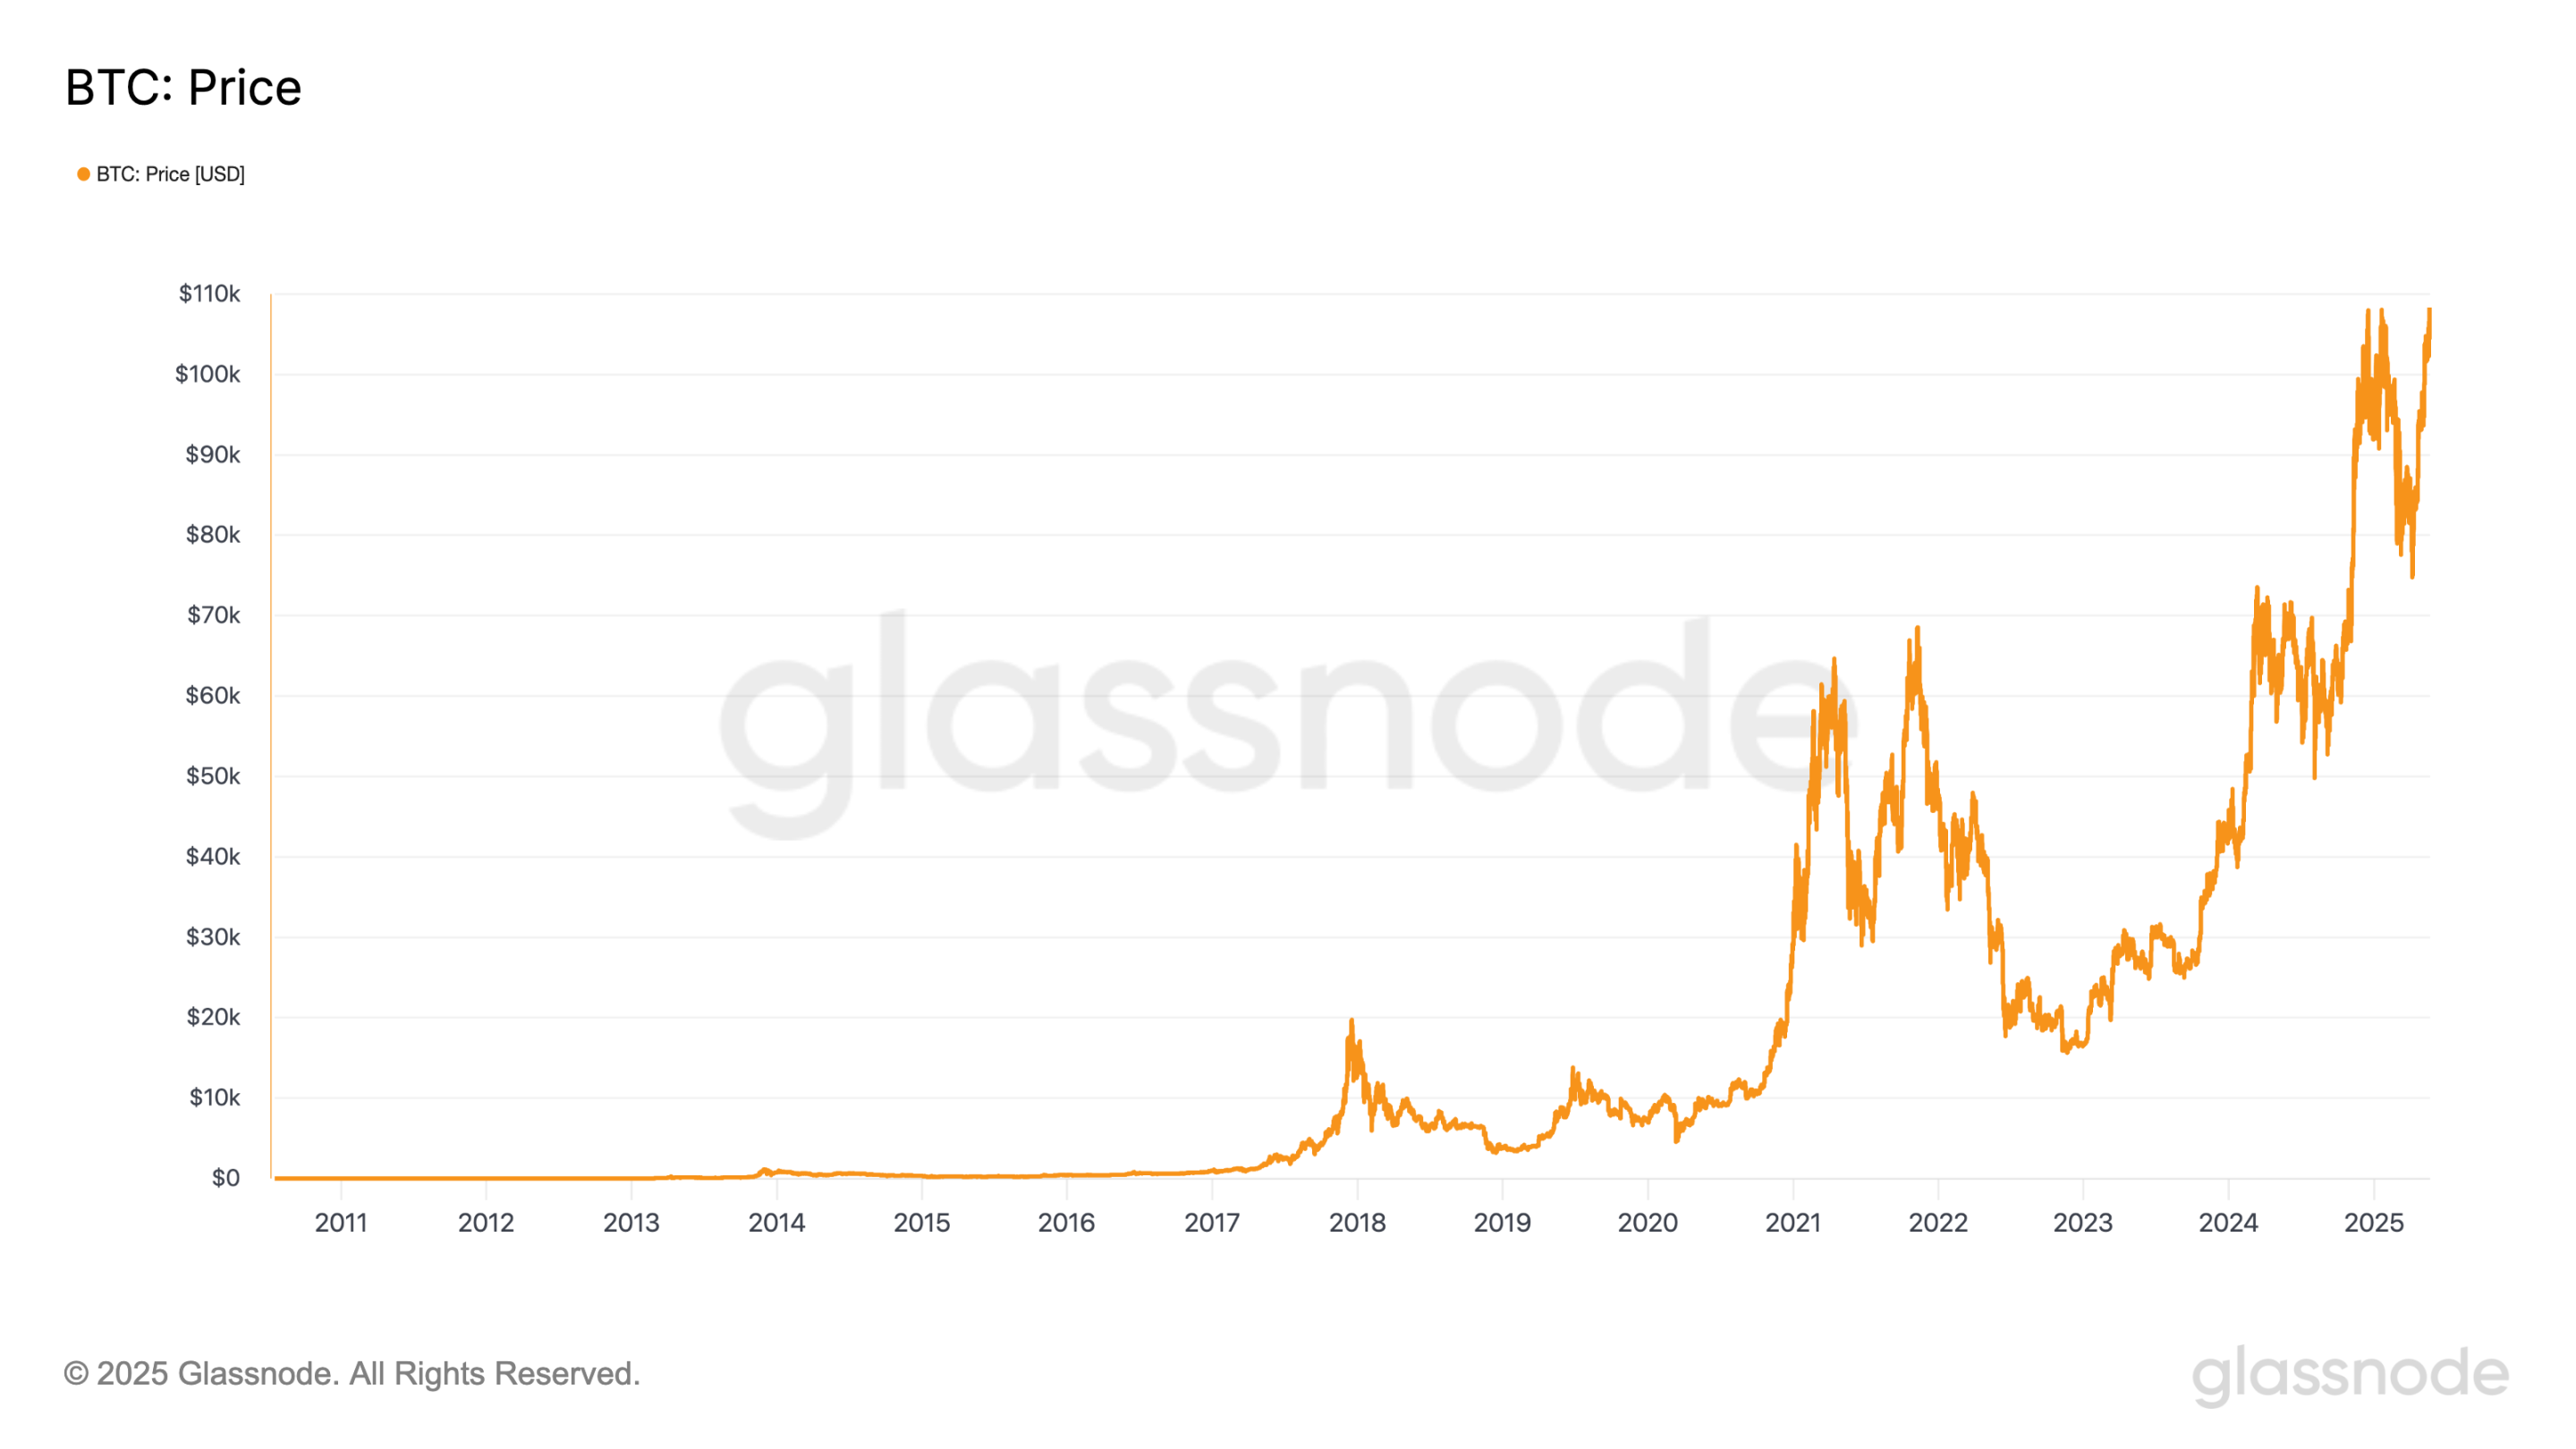
Although the historical price trend of Bitcoin has been volatile, it can be roughly divided into the following typical cycles of "halving drive + bull-bear rotation":

Since 2011, the price of Bitcoin has been evolving according to the logic of "halving driven - supply and demand imbalance - bull market outbreak - top correction". Each cycle ends with a higher price peak, and the double top structure in 2021 is undoubtedly the most worthy of warning.
Bitcoin hit its first interim high in April 2021. At that time, driven by the favorable stimulus of Coinbase's listing, the continuation of loose monetary policy, and the continuous accumulation of funds by Grayscale GBTC, market sentiment was high and the price broke through the $60,000 mark for the first time. But this high point did not last long. After entering May, with the Federal Reserve releasing forward-looking signals of balance sheet reduction and interest rate hikes, coupled with the policy risks of China's large-scale withdrawal of domestic mines, the Bitcoin market quickly fell into a correction, falling to around $30,000 in less than three months, completing a deep adjustment in the middle.
A few months later, the market gradually digested the negative sentiment and bottomed out in late summer. Driven by positive narratives and capital inflows, such as El Salvador's official inclusion of Bitcoin as legal tender, some investors' view of it as a potential hedging tool amid growing global inflation concerns, and the market's strong optimistic expectations for the approval of the first Bitcoin futures ETF in the United States, the market regained its momentum and briefly surged to an all-time high of about $69,000 on November 10, then quickly fell back, forming an obvious "double top structure" spanning several months together with the high point in April.
Ultimately, this triple resonance of new highs in price, active cashing on the chain, and shrinking demand constitutes a typical "false breakthrough" pattern. Bitcoin quickly fell back after a brief peak, starting a downward cycle. This structure is technically presented as "local new highs + volume divergence + instant reversal", which is a typical double-top signal and also provides an important precedent for the current market approaching historical highs.
Will history converge?
The slope and shape of the current trend are quite similar to those on the eve of November 2021. What is more noteworthy is that multiple indicators on the chain are releasing signals of structural convergence.
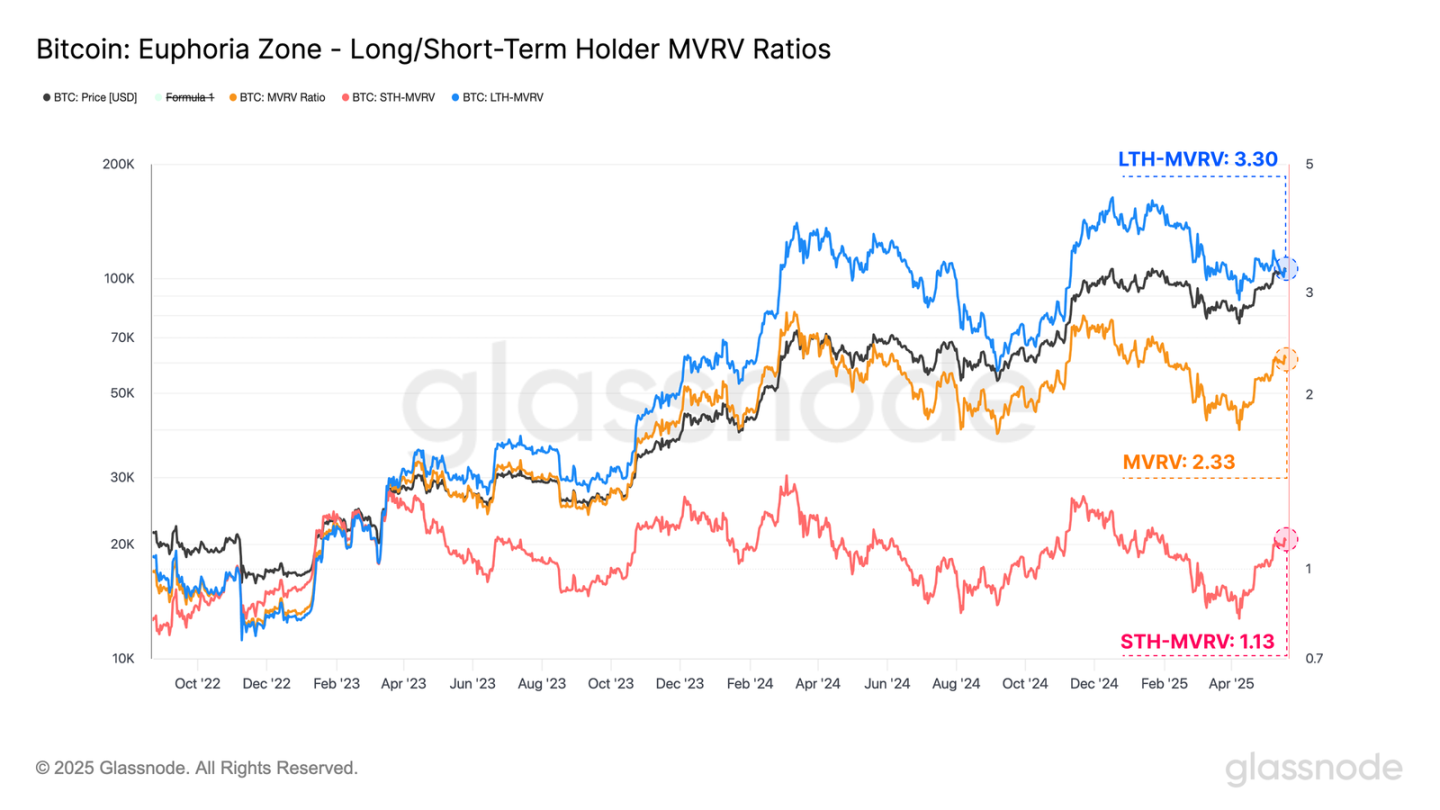
The latest data shows that the MVRV of long-term holders has climbed to 3.3, approaching the "greed red zone" defined by Glassnode (above 3.5); the MVRV of short-term holders has also risen sharply from the low of 0.82 to 1.13, which means that most short-term funds in the market have re-entered the floating profit range. From the perspective of behavioral finance, this structural change is a necessary condition for the formation of top pressure: when the vast majority of investors return to a surplus state, the desire to cash out will often increase simultaneously.
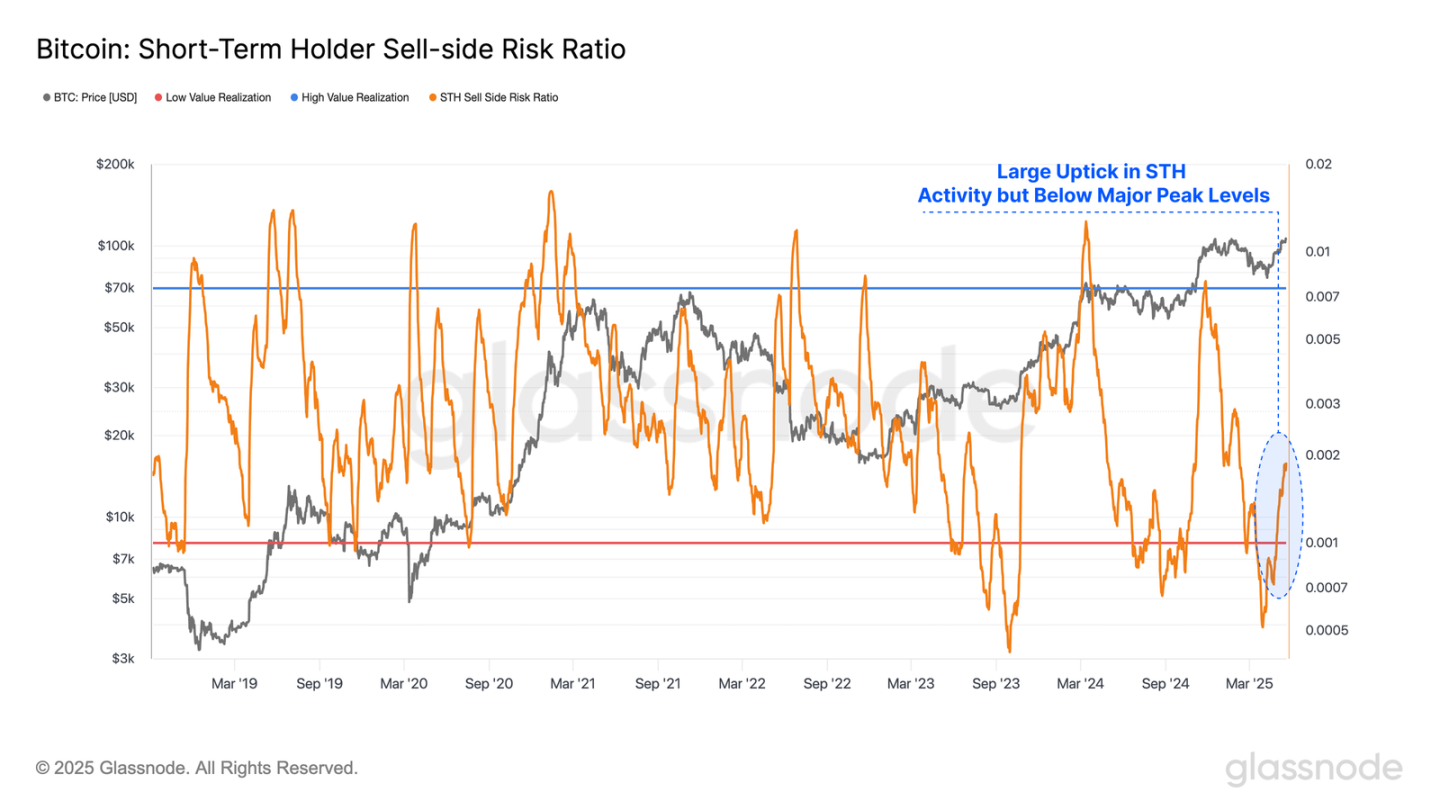
However, if we analyze from the perspective of "seller behavior pressure" of the on-chain structure, the current short-term investors' seller risk ratio has shown a significant increase, indicating that some profit release has taken place on the chain, but the overall value is still at a historically medium-low level. This state reflects that although investor sentiment has warmed up and some funds have chosen to stop profits in the floating profit range, the overall market has not yet entered an unbalanced state dominated by "collective cashing momentum".
This means that although the upward space has been initially suppressed, the market has not lost control. As long as the subsequent liquidity remains stable, the market still has the conditions to continue the structural upward trend, rather than being pushed to the ultimate top.
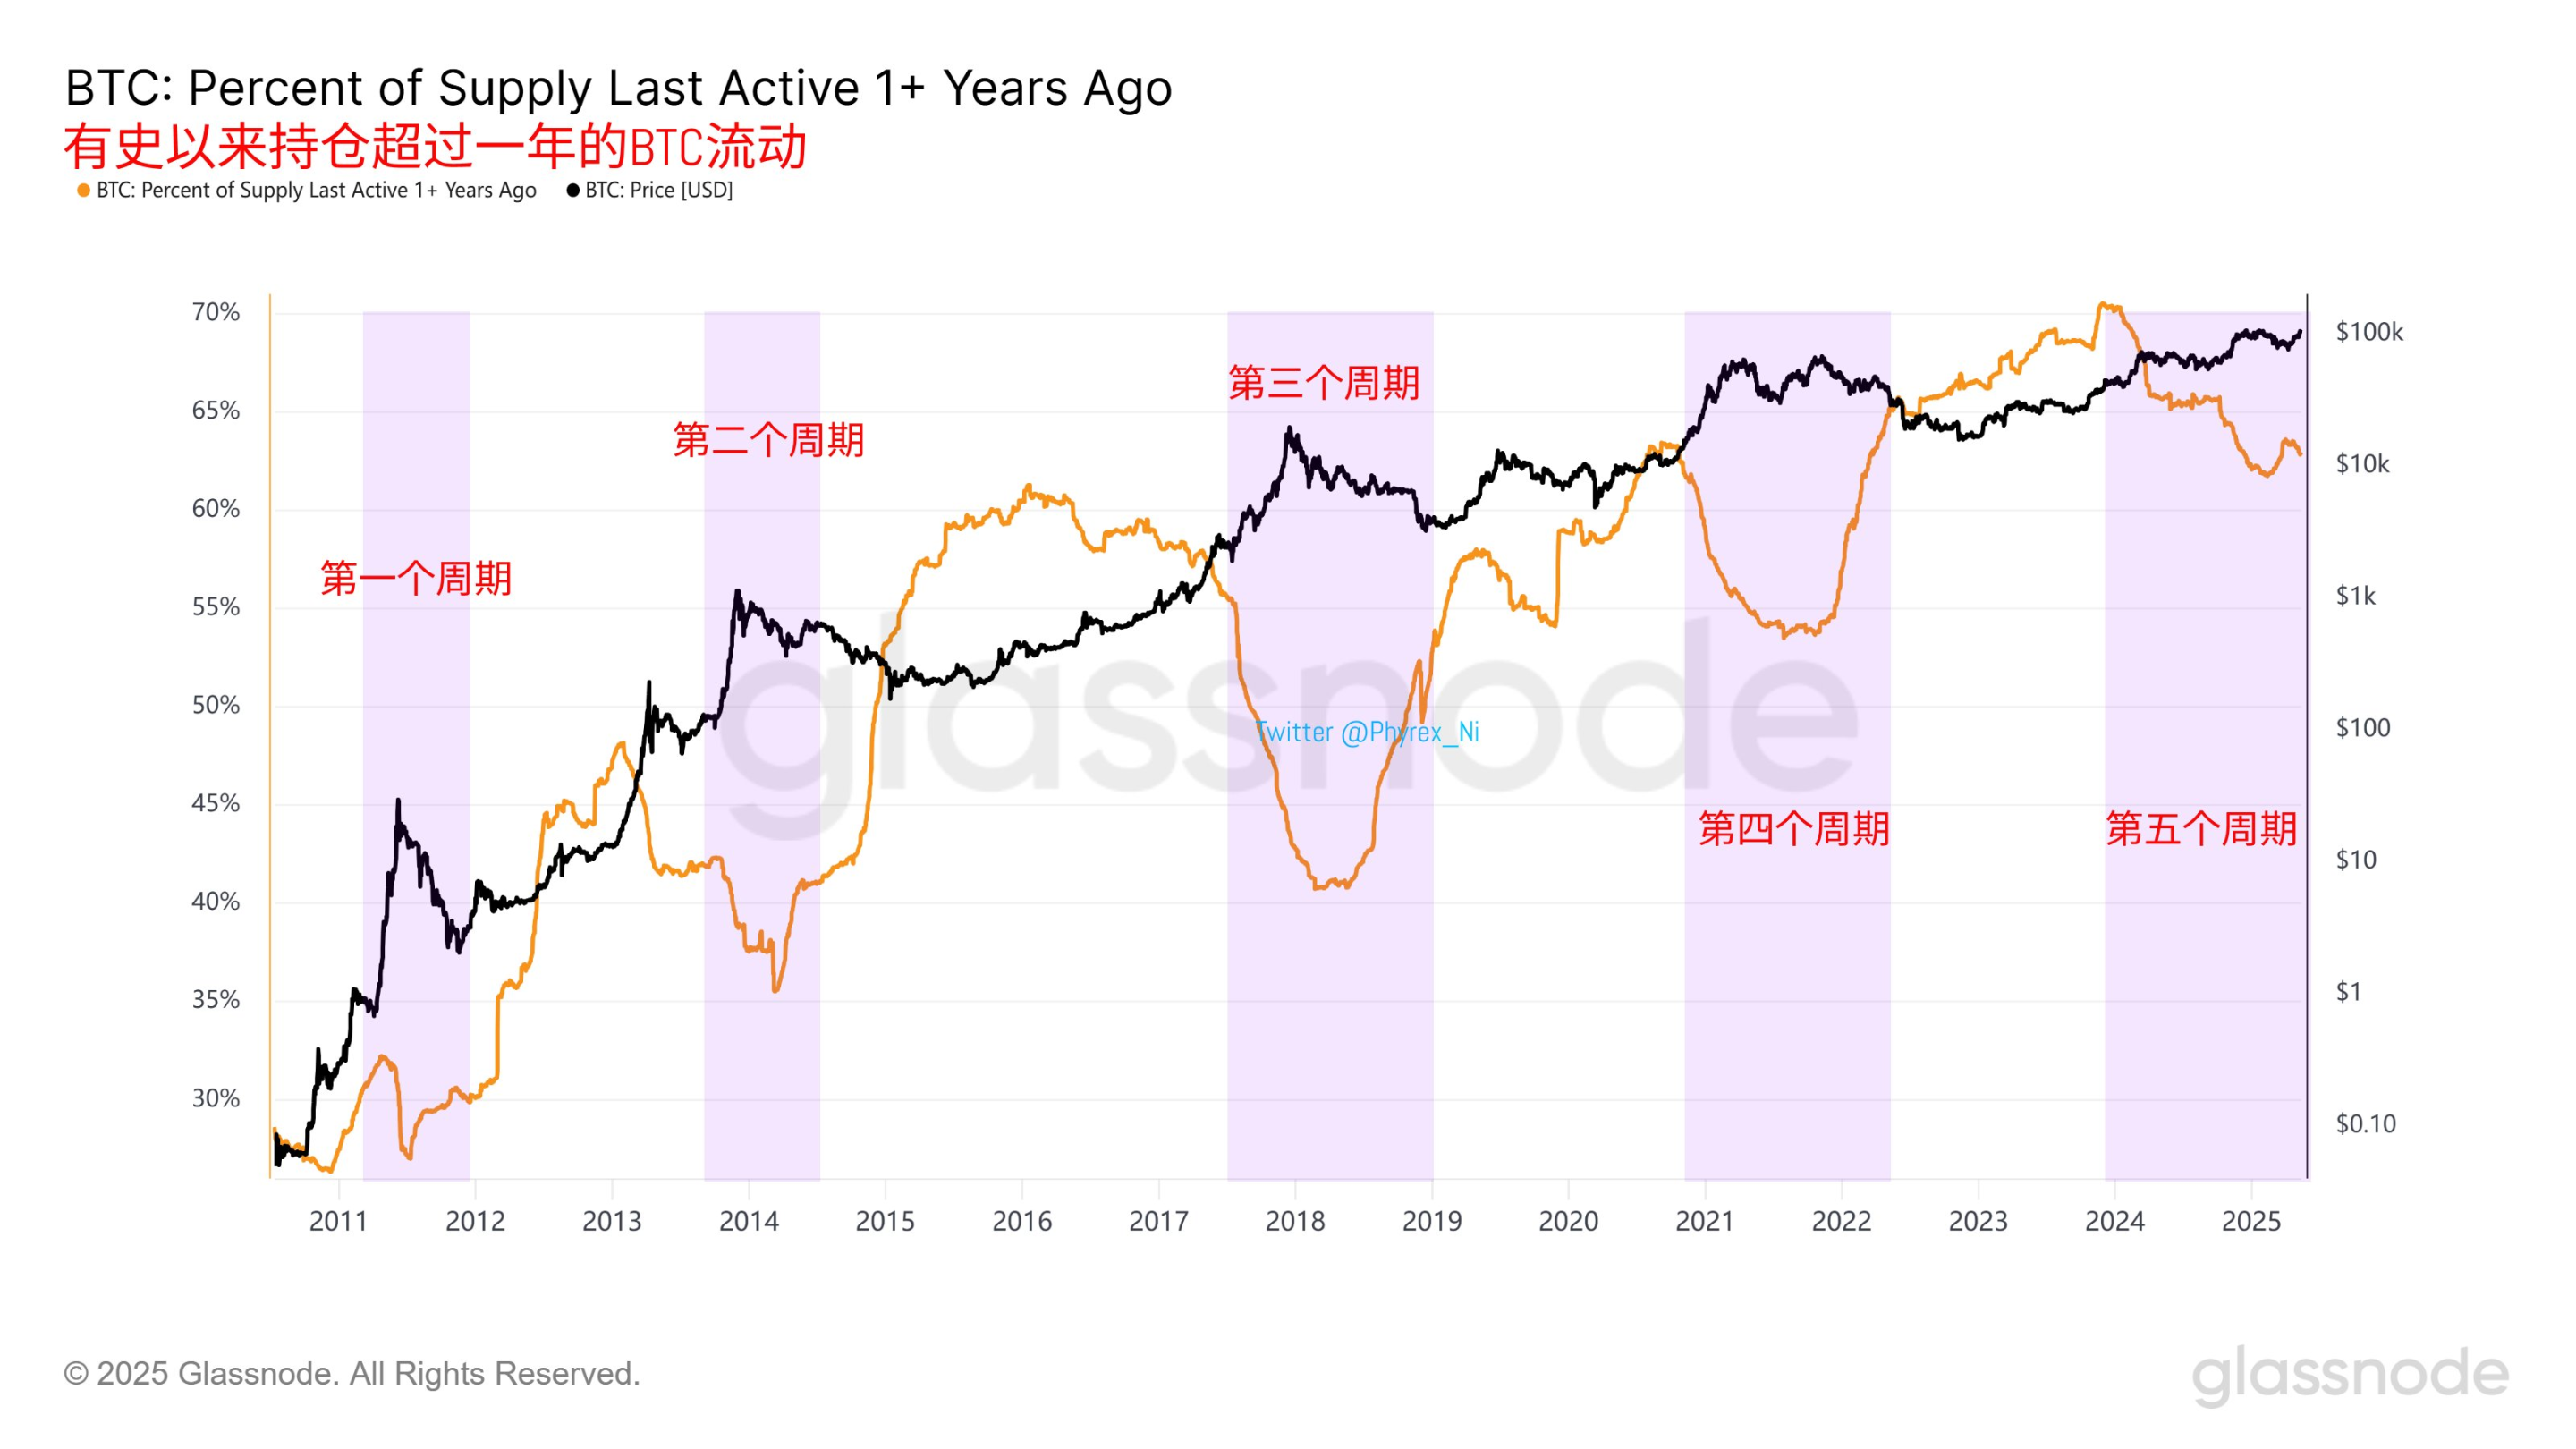
In general, the behavior of long-term holders has always been the most reliable slow-moving signal in judging the Bitcoin cycle. Whether it is 2013, 2017 or 2021, the end of every bull market is almost always accompanied by the concentrated distribution of such investors, and the new bull market cycle often begins with their re-accumulation.
The current round of market has entered the fifth major cycle of Bitcoin. If long-term holders have not yet started a new round of covering positions, this may mean that the market is still in the top area or is still building a high double top structure.
What will be the future trend?
According to the calculation method of on-chain analyst @Murphychen, BTC’s MVRV is used for evaluation, because MVRV essentially represents the relationship between funds and costs.
For more than a decade, Bitcoin has always followed the principle of large-scale divergence between MVRV and spot prices. That is, once a divergence occurs with higher prices but lower MVRV, the subsequent indicators will not be able to break through the previous highs, and the price space will be suppressed afterwards.
The logic behind this is that as turnover costs become higher and higher, exponential amounts of funds will be needed to continue pushing prices higher.
The highest point of this round of MVRV occurred on March 11, 2024, with a BTC price of US$72,000 and an MVRV of 2.78. Since then, even though the BTC price hit a new high on December 17 or January 21, the MVRV has never exceeded 2.78.
Therefore, for this round of BTC to reach the stars and the sea, the first and most important step is to break the MVRV large-scale divergence. According to the current RP dynamic value, the BTC price must break through $125,500.
