I. Market Performance: A Comparison of Scale and Layout
An exchange's open interest and trading volume directly reflect its market penetration and user activity. Furthermore, the open interest and trading volume of major exchanges in different markets reflect their ecosystem and strategic layout. Among them:
Binance leads other exchanges with an average daily spot trading volume of over $14.6 billion and an average daily derivatives trading volume of over $60.2 billion (CoinMarketCap data as of June 25, 2025).
Deribit Exchange dominates the BTC options market. According to Coinglass data, it holds approximately 80% of the global BTC options market share.
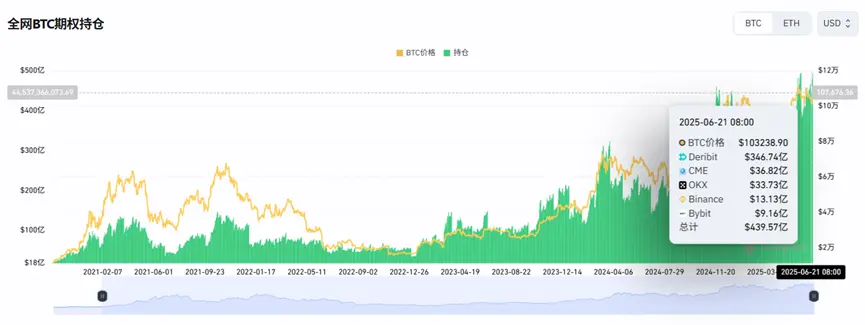
Source: Coinglass
II. Asset Security and Transparency: The Cornerstone of Trust
User asset security is the lifeblood of an exchange. An exchange's clean asset ratio reflects the quality of the platform's real, redeemable assets and is a core indicator of an exchange's fund security and financial health. A higher ratio indicates a lower likelihood of the exchange misappropriating user assets or relying on high-risk leverage.
DefiLlama provides the clean asset ratios of some exchanges.
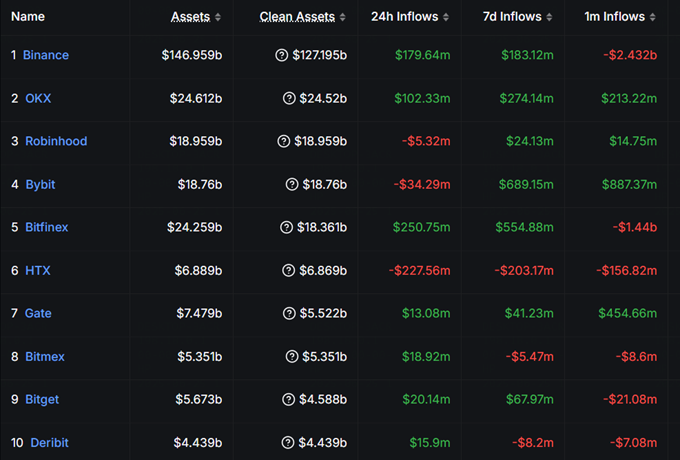
Source: DefiLlama
Among them, Robinhood, Bybit, Bitmex, and Deribit have a 100% clean asset ratio, indicating that these platforms' reserves are almost entirely comprised of highly liquid assets such as BTC, ETH, and stablecoins.
Proof of Reserves (PoR)ensures that custodians maintain sufficient on-chain reserves to cover all assets on the exchange's books and maintain the ability to accept payments. Leading exchanges such as OKX have proactively disclosed detailed PoR data on their official websites. The following figure shows some token reserve proofs provided by OKX.
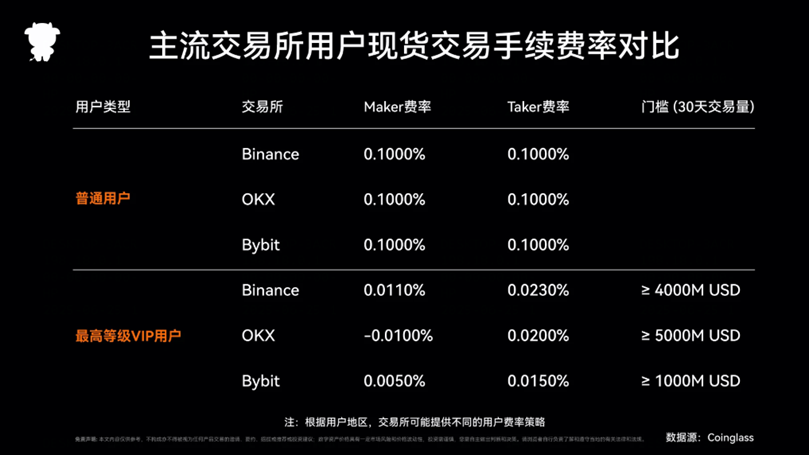
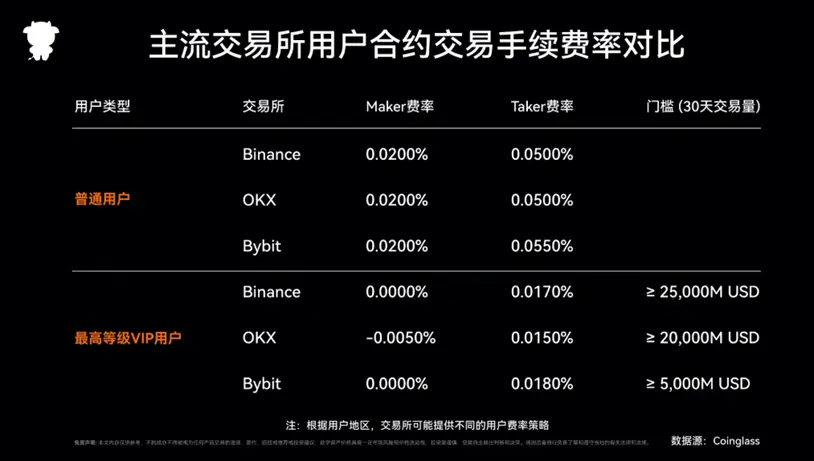
Source:https://www.okx.com/zh-hans-sg/proof-of-reserves Fee strategies not only effectively improve the efficiency of user funds but also provide more targeted service options. Exchanges can enhance their competitive advantage in the market through differentiated fee strategies. According to Coinglass data, the transaction fees for spot and futures trading on major exchanges are as follows: A reasonable fee structure can provide users with more targeted service options, reduce transaction costs, and thus enhance the platform's attractiveness. The exchange's revenue structure supports its continued operation and development and primarily includes: Using the AIDMA Consumer Behavior Model (Attention -> Interest -> Desire -> Memory -> Action) Action can clearly depict the user conversion path, including:
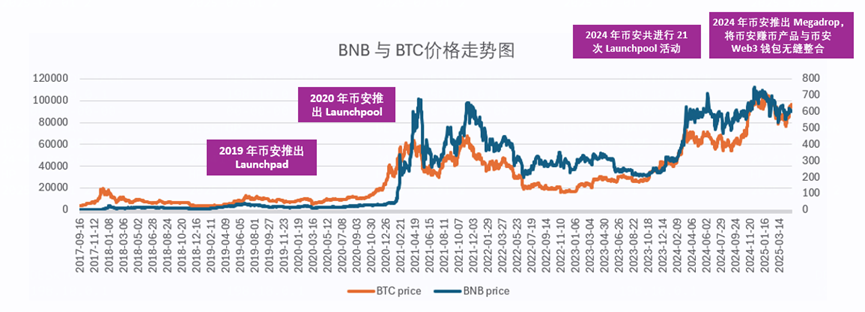
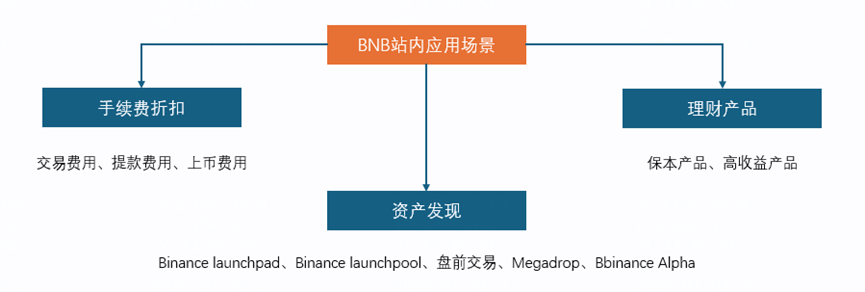
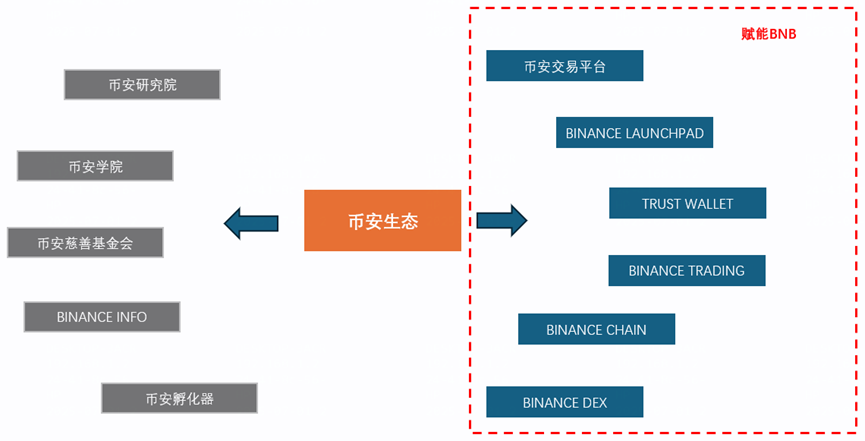
Users from different backgrounds and exchanges of different sizes have different strategies. For mature and new users, they often have some trading experience. Their AIDMA path begins with KOLs and project owners, sparking interest in the new exchange due to desirable features or activities. Lower transaction fees and low VIP thresholds spark a desire to use the exchange. Brand memory is formed through personal optimism or recommendations from friends, ultimately leading to conversion due to scarce currencies or exclusive events. For novice users, who often lack trading experience, the AIDMA path typically begins on social media platforms or through recommendations from friends. Interest is piqued by the prospect of making money, leading to a desire to profit from the opportunity, building trust through recommendations from friends, and ultimately completing registration driven by the desire for low-cost profit. Furthermore, large and small exchanges have different strategies. Top exchanges, with ample capital, leading brands, a wide selection of products, and extensive KOL networks, typically leverage these advantages, focusing on brand building, top-tier channel placement, highly attractive rebate systems, and collaborative traffic generation programs to fill user gaps. Small exchanges, limited by resources, often adopt aggressive strategies such as offering ultra-high commission rebates and being the first to list popular tokens (traffic tokens) in an effort to gain market share in niche markets or specific user groups. First, let's look at a price chart of BNB and BTC. The BNB and BTC price charts show similar price trends, with a medium-to-high correlation. During certain time periods, BNB outperformed BTC. In Binance's white paper, BNB's main functions are: As the Binance ecosystem continues to grow, BNB's use cases are also expanding. See the image below: Across the Binance ecosystem, over 50% of applications are directly powered by BNB. Therefore, platform coins are a crucial vehicle for the value of an exchange's ecosystem. Taking Binance's platform coin, BNB, as an example, its successful empowerment is reflected in: In February 2025, Bybit suffered a $1.5 billion Ethereum hack, which blockchain analysis firm Elliptic called the largest cryptocurrency theft in history. Its exemplary response highlights the key elements of crisis management:
To survive and differentiate themselves in the fierce competition, cryptocurrency exchanges must build comprehensive competitiveness across multiple dimensions: At the fundamental level, ensure leading trading volume and market presence, and prioritize asset security and transparency as the cornerstones of trust. Operationally, they must design attractive fee strategies, precisely target user groups, and optimize customer acquisition. Value-added services must be deeply empowered through platform tokens, making them the core value carriers of the ecosystem. Risk management requires establishing comprehensive crisis warning and response mechanisms. Only by continuously innovating across multiple key dimensions and cultivating unique advantages can exchanges earn user trust and maintain their position in this rapidly changing market.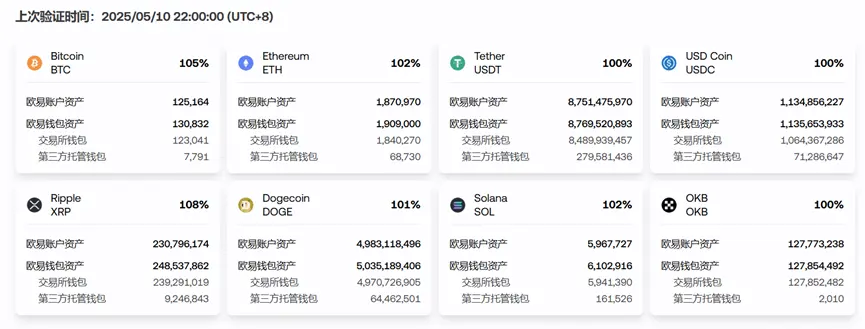
III. Fee Strategy: Improving Fund Efficiency and Attracting Users
Four. Core Revenue Sources: Diversified Profit Models
V. User Acquisition: Precision Reach and Conversion Path
VI. Platform Coin Empowerment: Building Ecosystem Value Using BNB as an Example
VII. Crisis Response: Bybit's Example of averting danger
Summary