Crypto Options Analysis Tool GVOL_GEX Indicator and Its Principle
In August 2022, Amberdata launched “GVOL_GEX” on gvol, which enables options traders to evaluate the position status of market makers: long gamma vs short gamma.
What is this tool, why is it different from other tools, and how can you integrate it into your trading system?
GEX (Gamma Exposure) originated from @SqueezeMetrics and aims to calculate the Gamma exposure of market makers' positions and the number of underlying contracts they must trade to keep their positions delta hedged neutral.
That is, the impact of the gamma value of the market maker's option position on the spot (contract) price——
“Positive Gamma” => Higher potential stability in price due to “buy low, sell high”
“Negative Gamma” => Higher potential price volatility due to “selling low and buying high”
See the table below
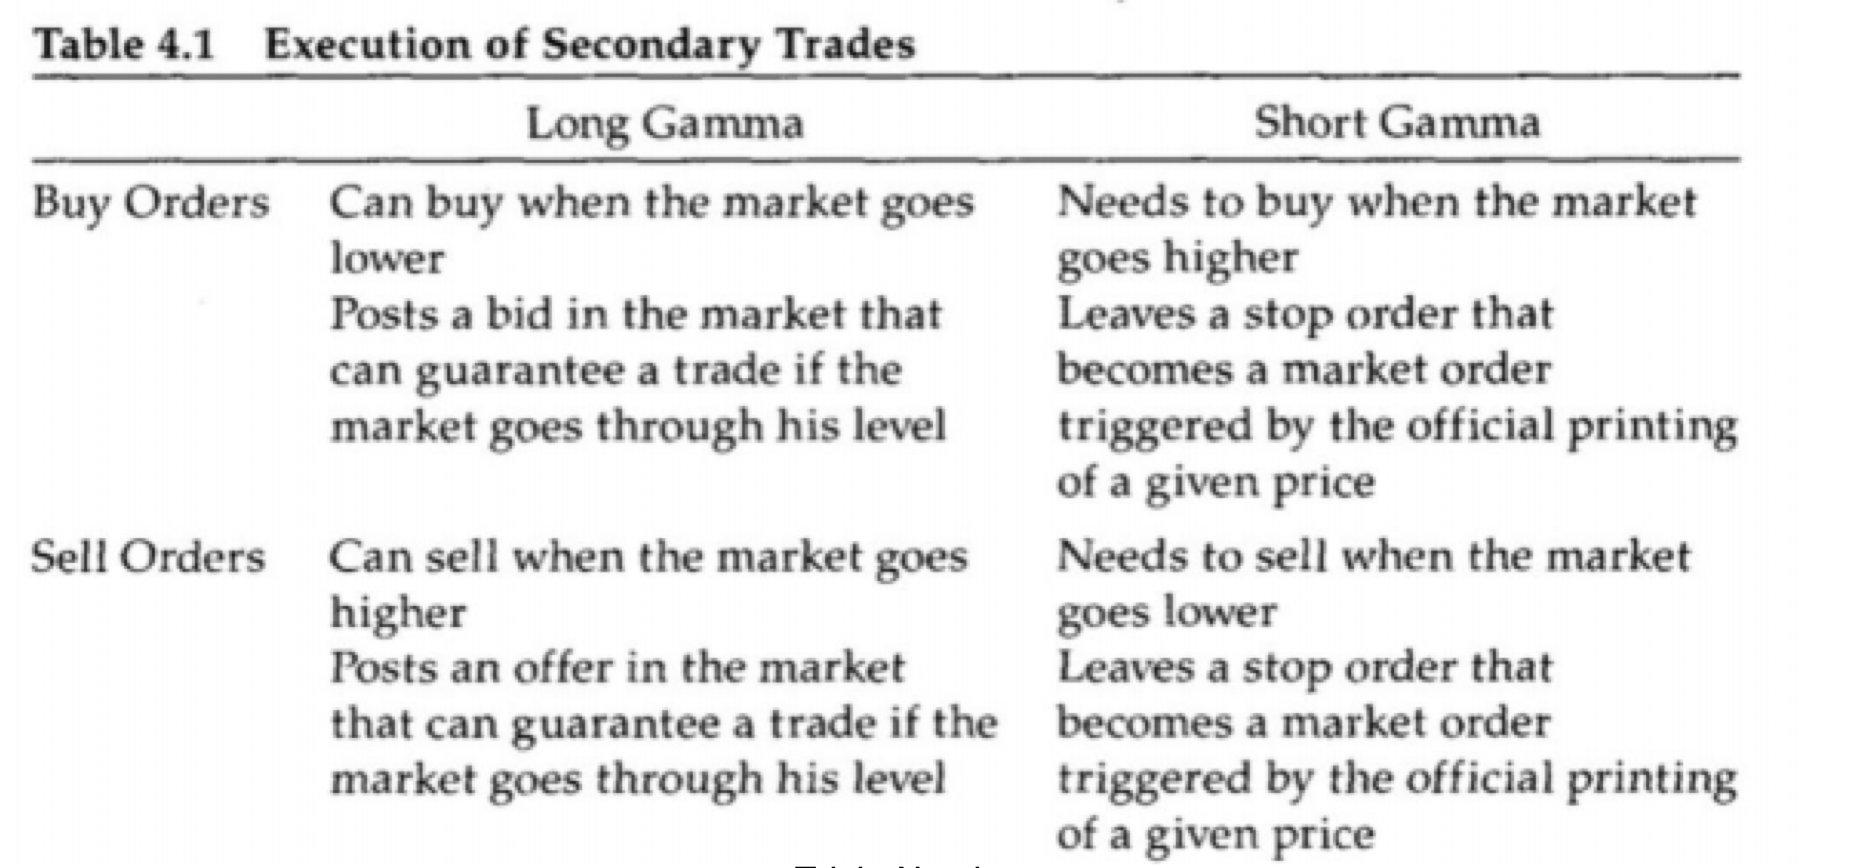
“Dynamic Hedging” (Figure)
The main criticism of this indicator is the "assumptions" behind it regarding the direction of the trade:
All call options are sold by participants (positive gamma for market makers)
All put options are bought by participants (negative gamma for market makers)
Although these assumptions had some validation in the stock market when the paper was published, they have lost validity over time.
For the crypto options market, these assumptions simply don’t make sense as traders show bidirectional interest in puts/calls.
Amberdata overcomes this limitation by reconstructing the transaction direction using a proprietary algorithm “GVOL_DIRECTION”, which consists of more than 30 heuristics to estimate the “correct direction” = the party of the initiator.
Using this algorithm, Amberdata is able to tag each trade by tracking the order book at the millisecond level to calculate and maintain a database of market makers’ gamma exposure: GVOL_GEX.
GVOL_GEX can be aggregated by strike price and multiplied by the corresponding Gamma value. This gives us a way to construct a Gamma level chart!
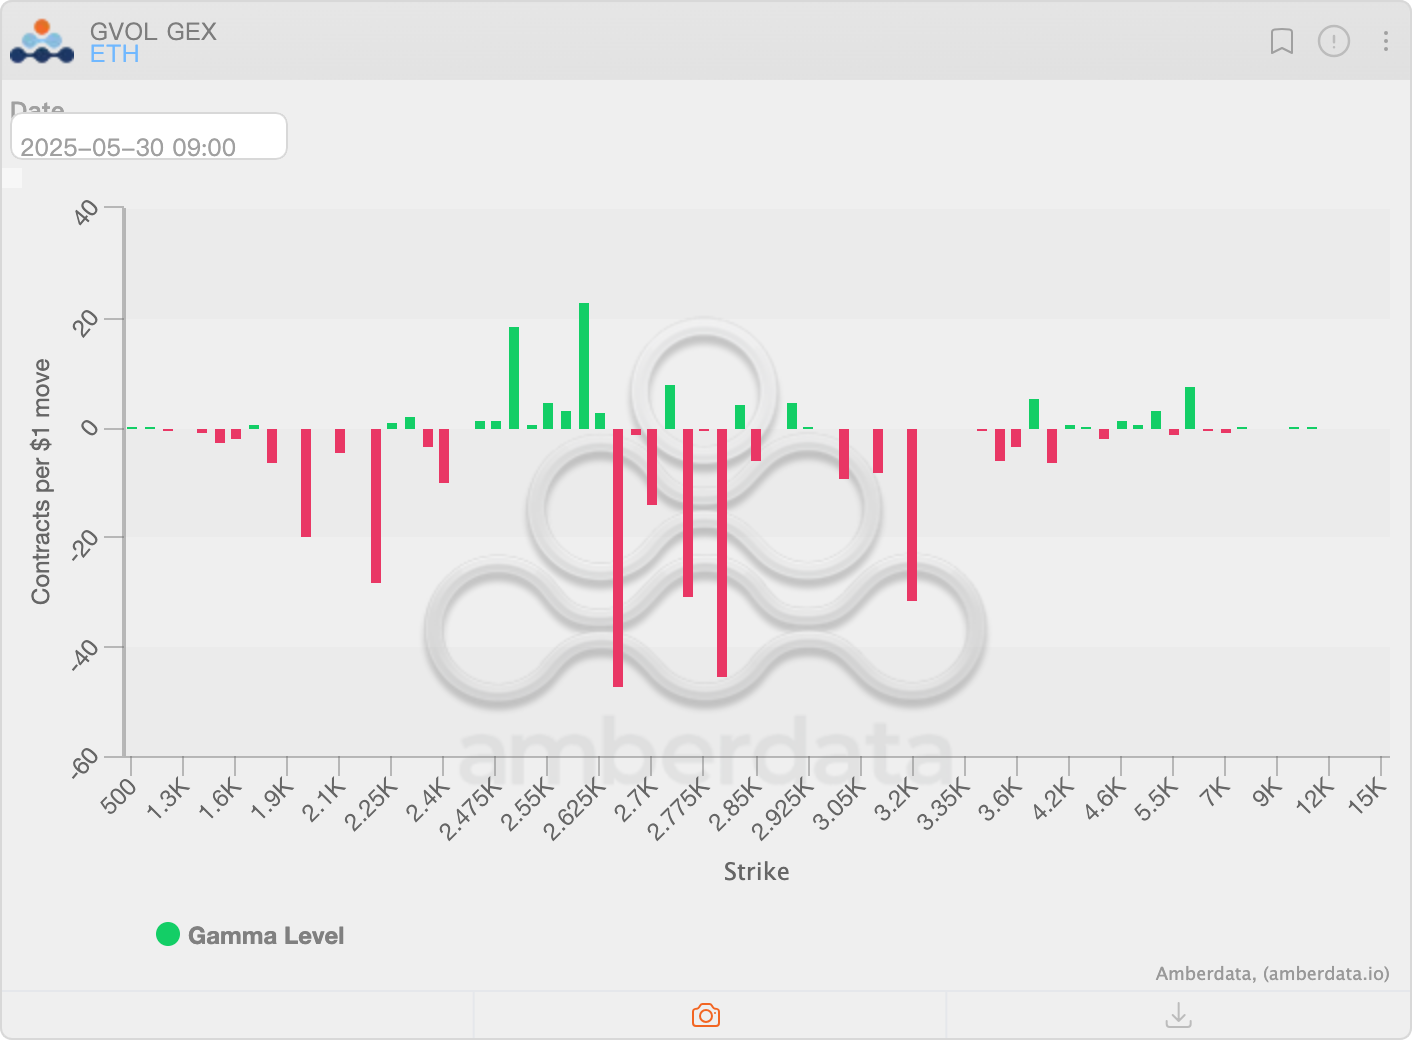
If the strike price is at a negative gamma value, the underlying is more likely to move from there when price starts to accelerate, and vice versa, if the strike price is at a positive gamma value, the underlying is more likely to encounter some form of resistance/viscosity.
This effect is most pronounced before expiration of larger contracts and during periods of low trading volume (weekends/holidays), when market makers’ hedging activities have the greatest impact on the underlying market.
Of course, this effect is not always present and must be achieved "somehow".
Since crypto options are relatively small, spot prices may not be affected, but hedging activity in perpetual contracts may affect funding rates/basis points around these inflection points.
Extremely valuable for a ∆ neutral hedge portfolio.
Regardless, incorporating this new perspective on the markets may help traders confirm their ideas, identify support and resistance, or evaluate long/short swing opportunities, find edges, capture alpha, and identify big orders.
In short, the above explanation comes from Amberdata, which can help traders understand the indicator more clearly and apply it appropriately. If you have any experience in using this indicator, please leave a message to discuss it.