
1. Agreement implementation: the “seesaw effect” under the shift of risk preference
On May 12, Beijing time, China and the United States reached a tariff truce agreement in Geneva, pressing the "pause button" for the trade friction that has lasted for several years. The agreement includes suspending the 24% mutual tariff for 90 days, retaining the 10% basic tax rate, and establishing a third-country consultation mechanism. This progress directly stimulated the S&P 500 index futures to jump 3%, and the Nasdaq closed up 4.35%. However, Bitcoin unexpectedly fell back to a low of $100,700 after hitting $105,720, forming a rare pattern of "stock-coin divergence". As of press time, BTC has rebounded to $102,600.
Pivot Data:
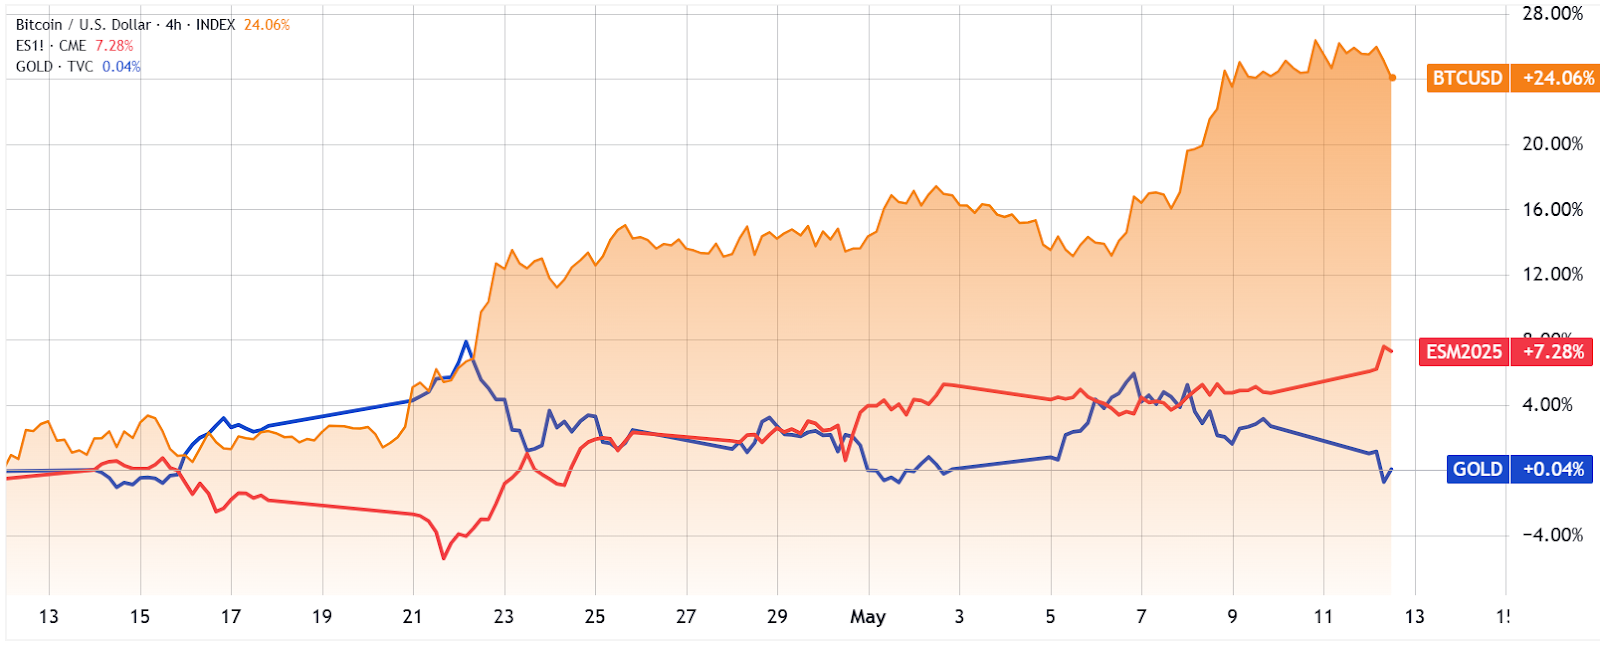
Bitcoin/USD (orange) versus S&P 500 futures (red) and gold (blue). Source: TradingView
- Short-term capital diversion: In the past 30 days, Bitcoin has risen by 24%, while the S&P 500 has only risen by 7% and gold prices have remained flat. As the trade agreement reduces market uncertainty, some funds have flowed back from crypto assets to traditional stocks, causing the 30-day correlation between Bitcoin and traditional markets to rise to a historical high of 83%1.
- Institutional holdings are a "double-edged sword": MicroStrategy and its affiliates recently increased their holdings by 13,390 BTC, bringing their total holdings to 1.19 million (6% of the circulation). Although this is seen as a long-term positive, the market is concerned that its concentrated holdings may pose a risk of "price manipulation", especially when the average cost climbs above $100,000, and short-term selling pressure is expected to increase.
2. Technical game: $106,000 becomes the "bull-bear watershed"
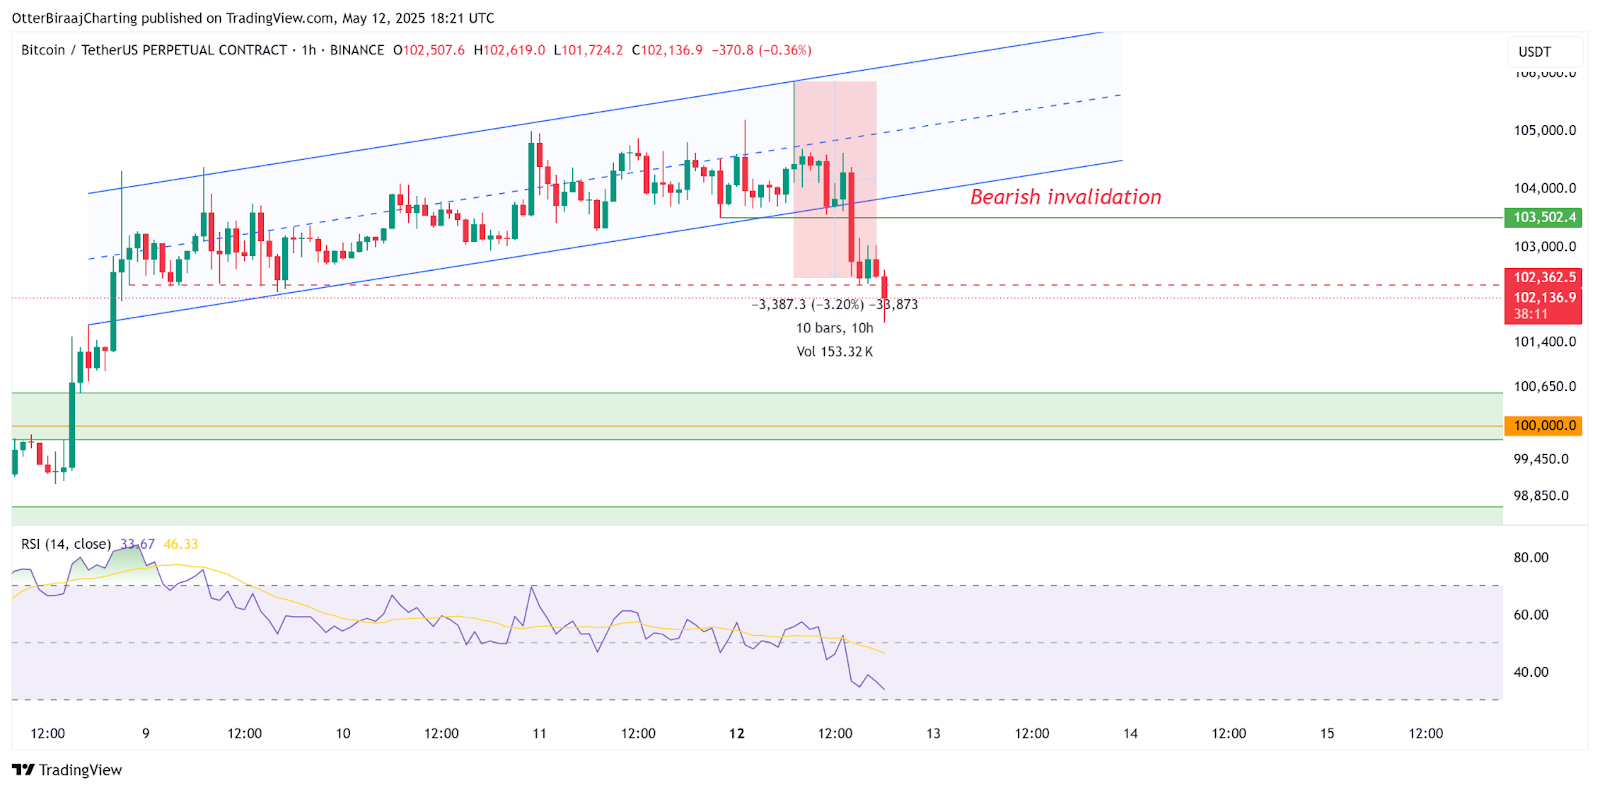
On May 12, Bitcoin briefly broke through $105,800 and then quickly fell back to $101,400. The 1-hour candlestick chart showed that the price fell below the lower edge of the ascending channel.
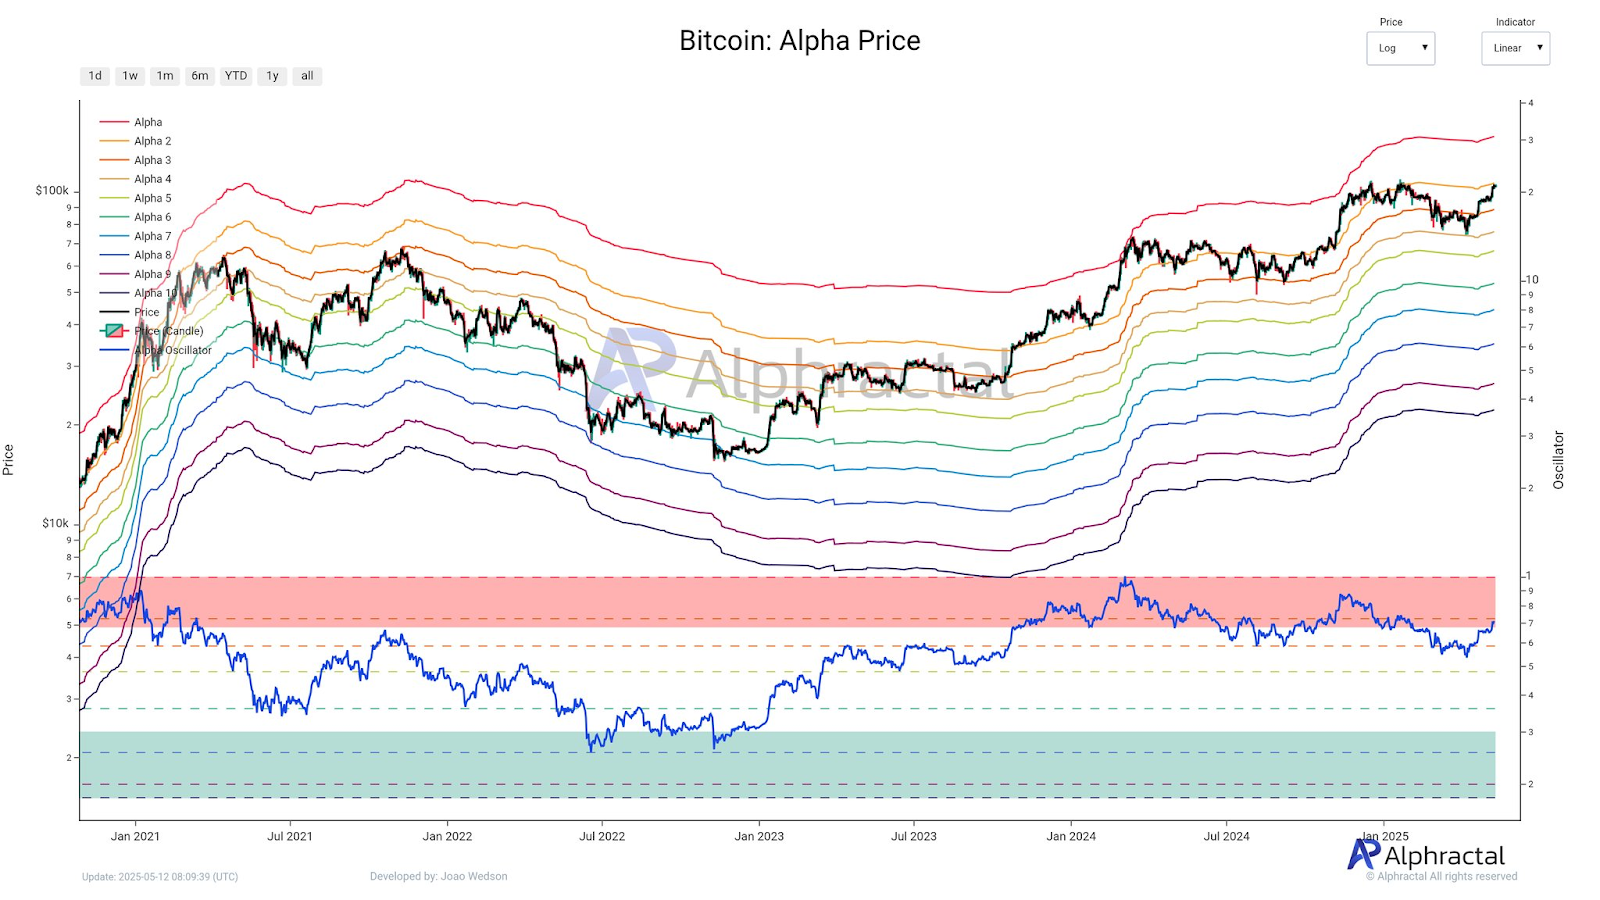
Bitcoin Alpha price levels. Source: X.com
Joao Wedson, CEO of Alphractal, noted that there is an “alpha price” resistance zone around $106,000, where long-term holders may trigger profit-taking.
Key Risk Indicators:
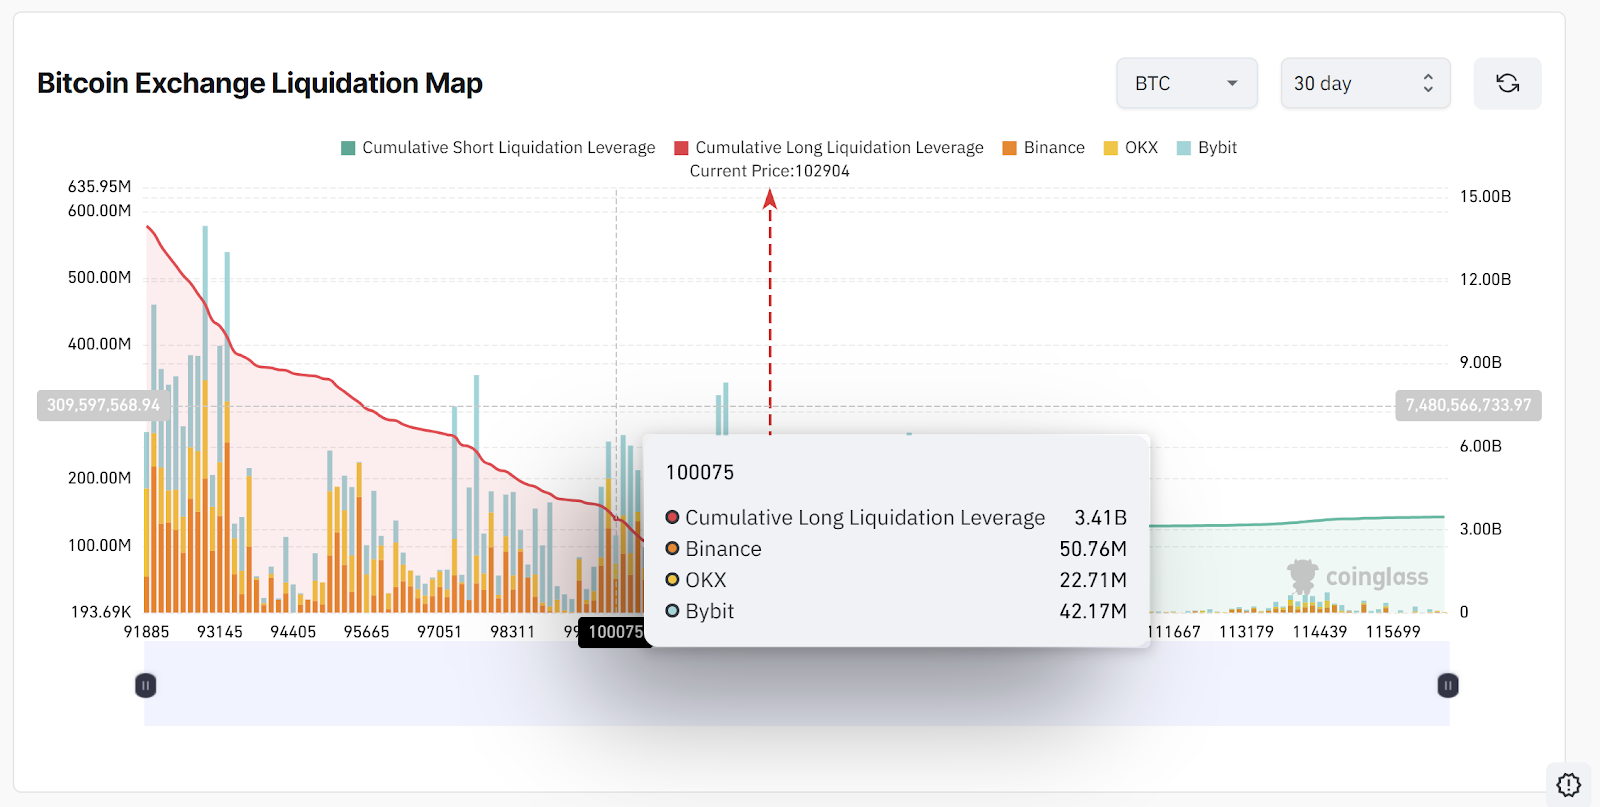
- Liquidation Magnetic Effect: CoinGlass data shows that if the price falls to $100,000, about $3.4 billion of long leveraged positions will face the risk of forced liquidation, forming short-term downward pressure.
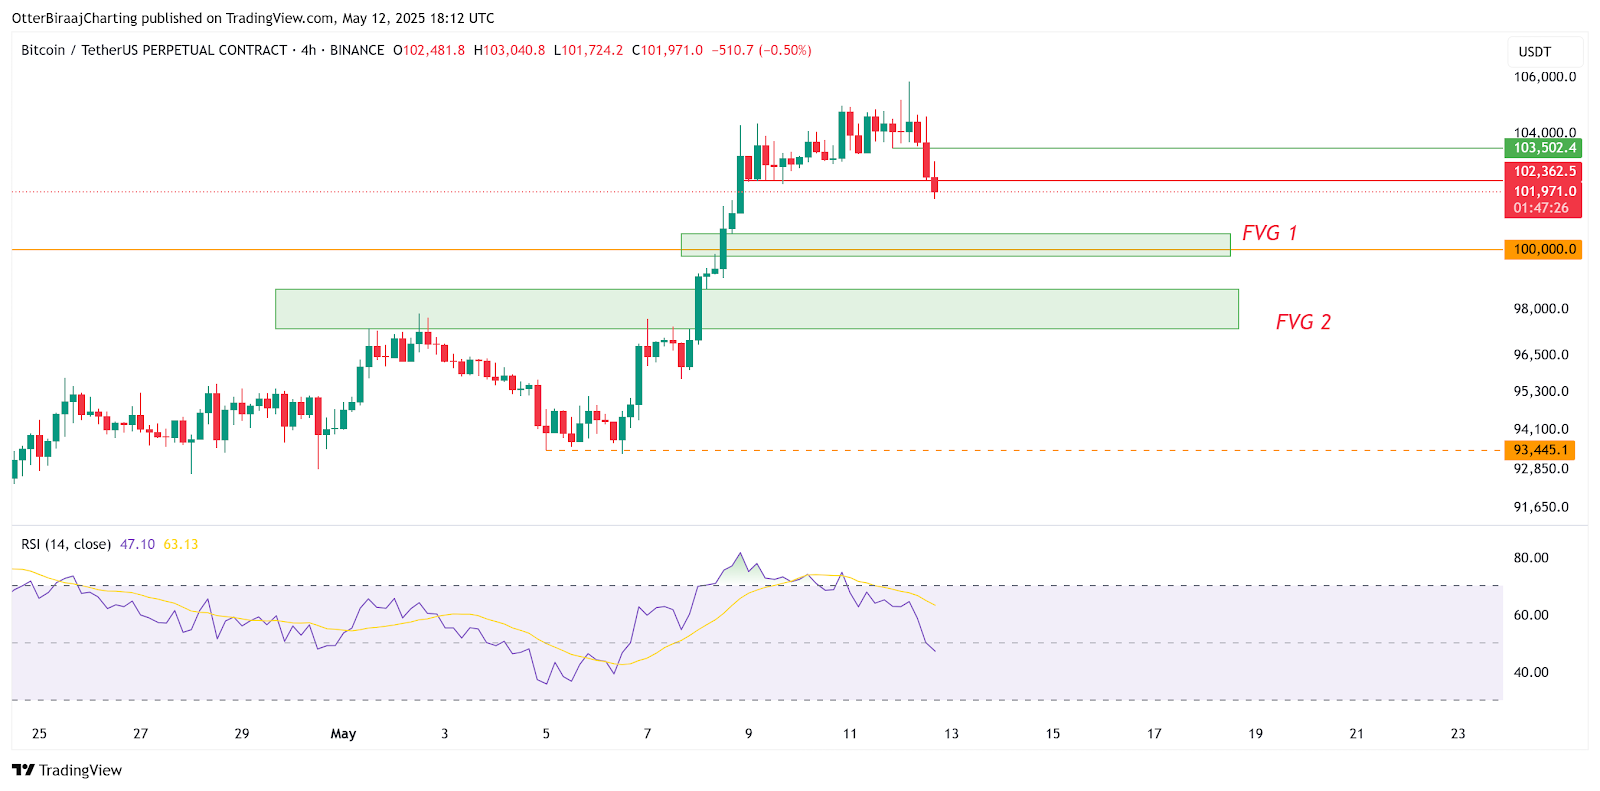
- Support range verification: The four-hour chart shows that $99,700-100,500 is the recent "fair value gap" (FVG). If it falls below, it may further fall to the $97,363-98,680 range, a pullback of 8%.
3. Macro variables: CPI data and the "butterfly effect" of the US dollar index
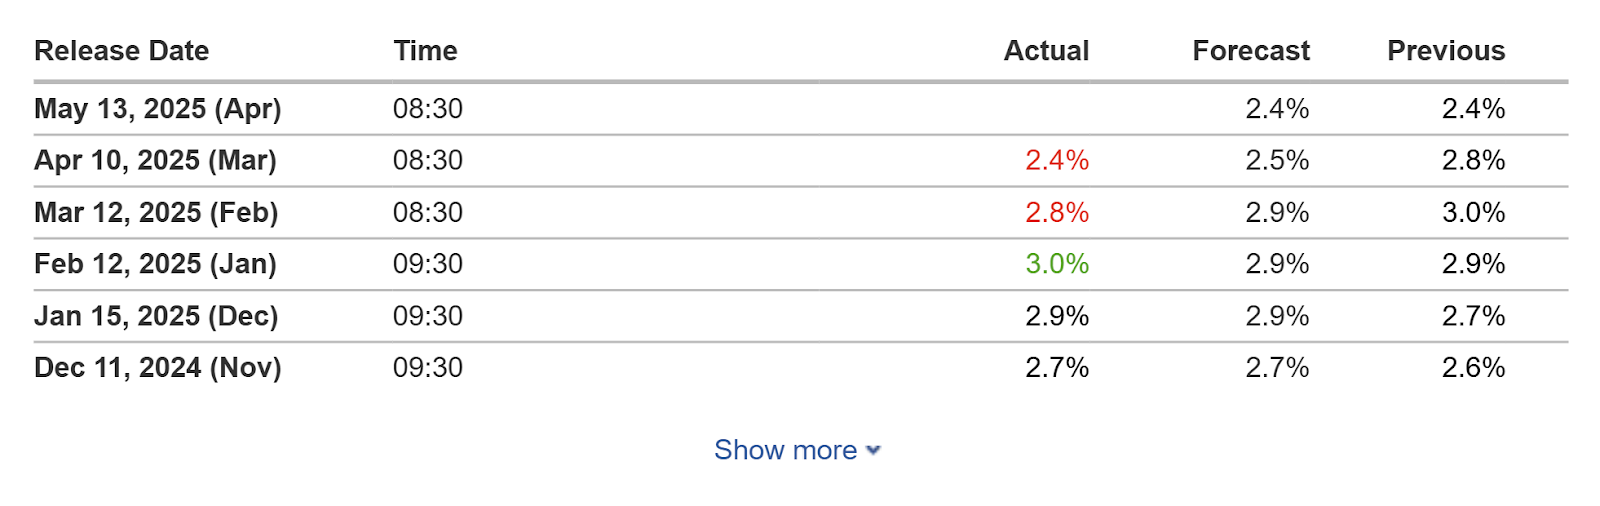
The US CPI data for April released on May 13 has become the focus of the market. Previously, the CPI for March was 2.4% (lower than the expected 2.5%). If the April data continues the downward trend, it may strengthen the Fed's expectations of rate cuts and benefit risky assets; on the contrary, if inflation rebounds, the US dollar index (DXY) may break through the 30-day high, suppressing Bitcoin.
Association logic:
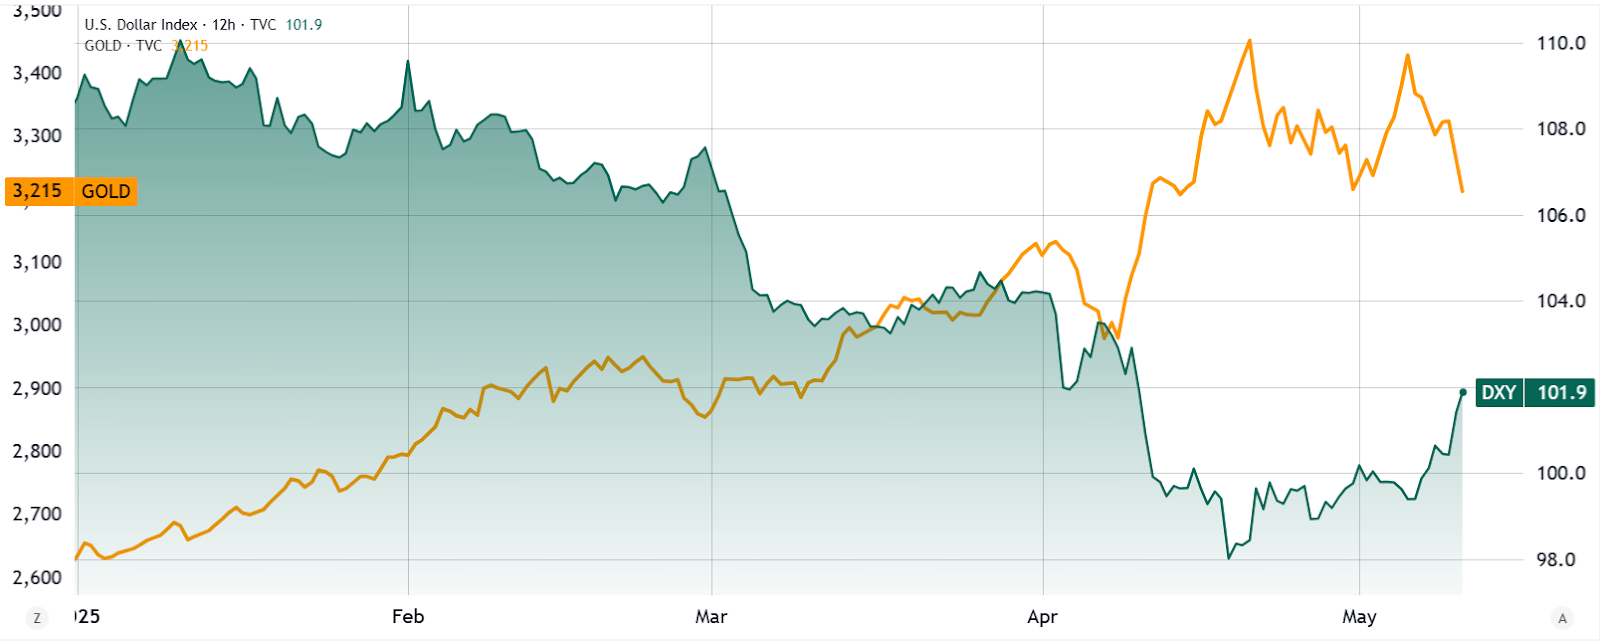
Gold/USD (left) vs. US Dollar Index (right). Source: TradingView
- Gold and BTC's "safe haven alternative": On May 12, gold fell 3.4%, and DXY climbed to a 30-day high, reflecting investors' shift from scarce assets to the US dollar and the stock market. This round of movement verifies the short-term positive correlation between Bitcoin and gold.
- Long-term narrative of the loosening of US dollar hegemony: Despite short-term setbacks, the "local currency settlement pilot" clause in the agreement may weaken the US dollar's trade settlement status. Historical data shows that during the 2018-2020 trade war, Bitcoin eventually broke through $20,000 after an initial correction, and its "decentralized settlement tool" attribute may regain attention in the medium and long term.
4. Market sentiment divergence: "divergence signals" of whale withdrawal and ETF fund inflows
On-chain data shows that the number of addresses holding more than 10,000 BTC decreased by 12, and the exchange reserves decreased by 1.8%, suggesting that some large investors chose to take profits.
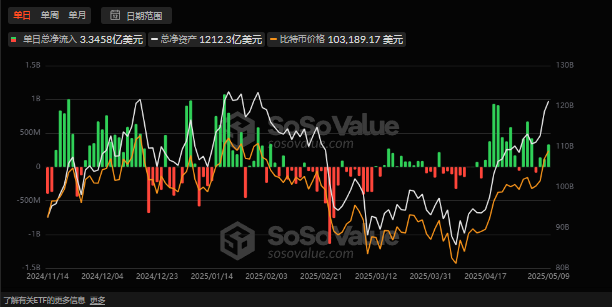
However, the U.S. spot Bitcoin ETF saw a net inflow of $2 billion from May 1 to 9, and institutional funds continued to show a "buy more as the price rises" trend.
Analysis of structural contradictions:
- Retail leverage risk: The current altcoin trading volume has surged by 280%, but HTX Research points out that its leverage ratio is still in a safe range. In contrast, Bitcoin contract positions are concentrated between $98,000 and $100,000, which is prone to triggering a "double kill of longs and shorts".
- Institutional "bottoming" logic: Wall Street giants such as BlackRock have formed a liquidity monopoly through ETFs, compressing Bitcoin's daily volatility from 18% to 9%, and gradually tilting pricing power towards traditional capital.
V. Future Prediction: Short-term shocks and long-term paradigm shift
Scenario 1 (optimistic):
If the CPI data is lower than expected, coupled with the expectation of a Fed rate cut, Bitcoin may quickly recover to above $105,000 and hit the $120,000 mark. Institutional holdings and ETF inflows will build a "moat", making the probability of falling below $100,000 less than 20%.
Scenario 2 (Caution):
If the CPI rebound triggers a stronger dollar, BTC may drop to the support level of $97,000-99,000. However, MicroStrategy's $21 billion capital increase provides it with "ammunition", and the selling pressure from long-term holders is limited. After the correction, it may enter the $90,000-110,000 box.
Conclusion: Finding Certainty in Uncertainty
The short-term volatility of Bitcoin is essentially a tug-of-war between the pricing power of traditional finance and the crypto ecosystem. Investors need to be wary of leverage risks and policy variables, but should pay more attention to the evolution of its underlying logic: when tariff barriers collide with blockchain technology, Bitcoin is evolving from "digital gold" to "cross-border value transfer protocol."
The real victory of Bitcoin does not lie in defeating fiat currency, but in proving that humans need diversified value anchors.
