
Author: S4mmy's Web3 Snippets
Compiled by: TechFlow

I’ll use my decade of experience in both traditional finance and the corporate world to help you break down complex issues into digestible chunks.
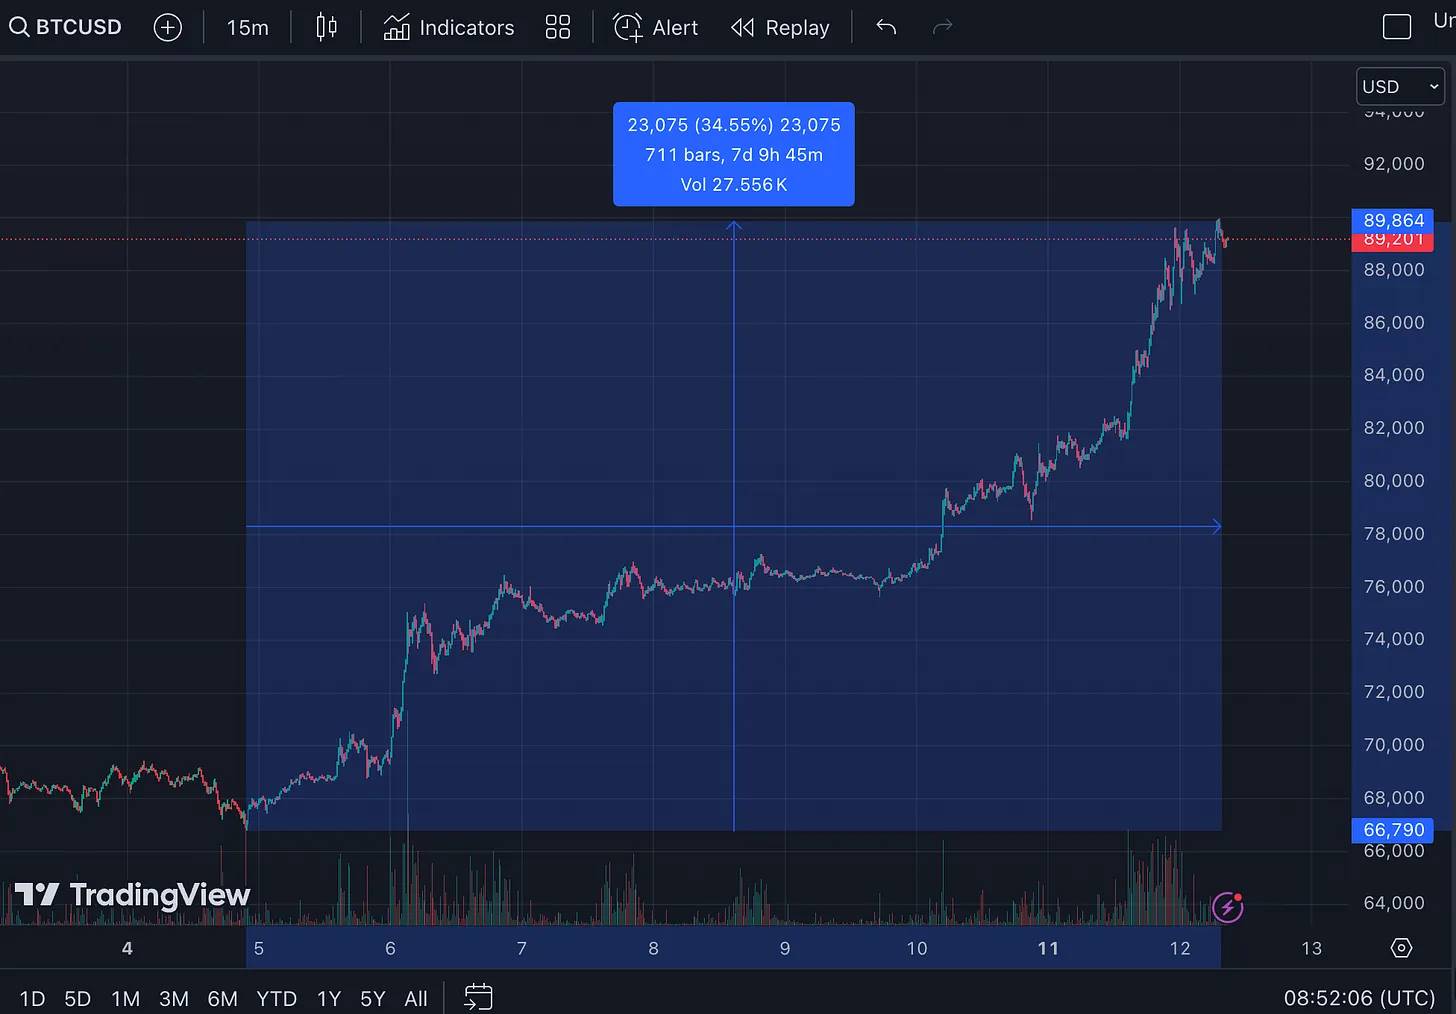
Bitcoin price action has risen sharply following the results of the presidential election in anticipation of Trump’s inauguration in January.
Last week, the price of Bitcoin rose 35% to $90,000 before falling back slightly. Data from Trading View.
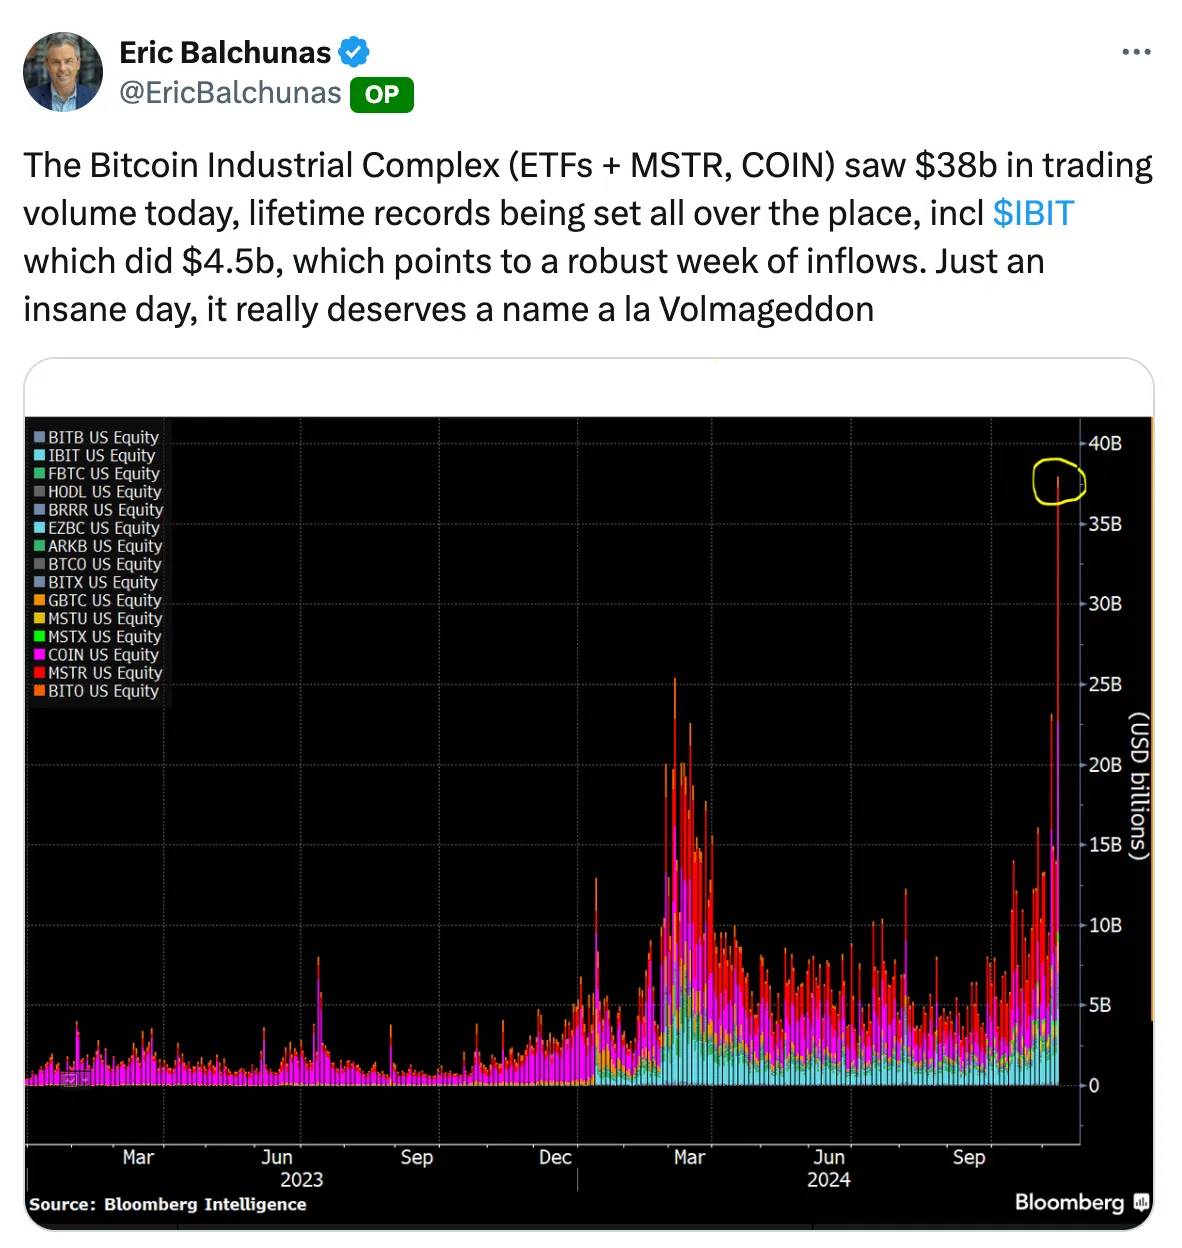
Trading volume of Bitcoin-related products reached $38 billion.
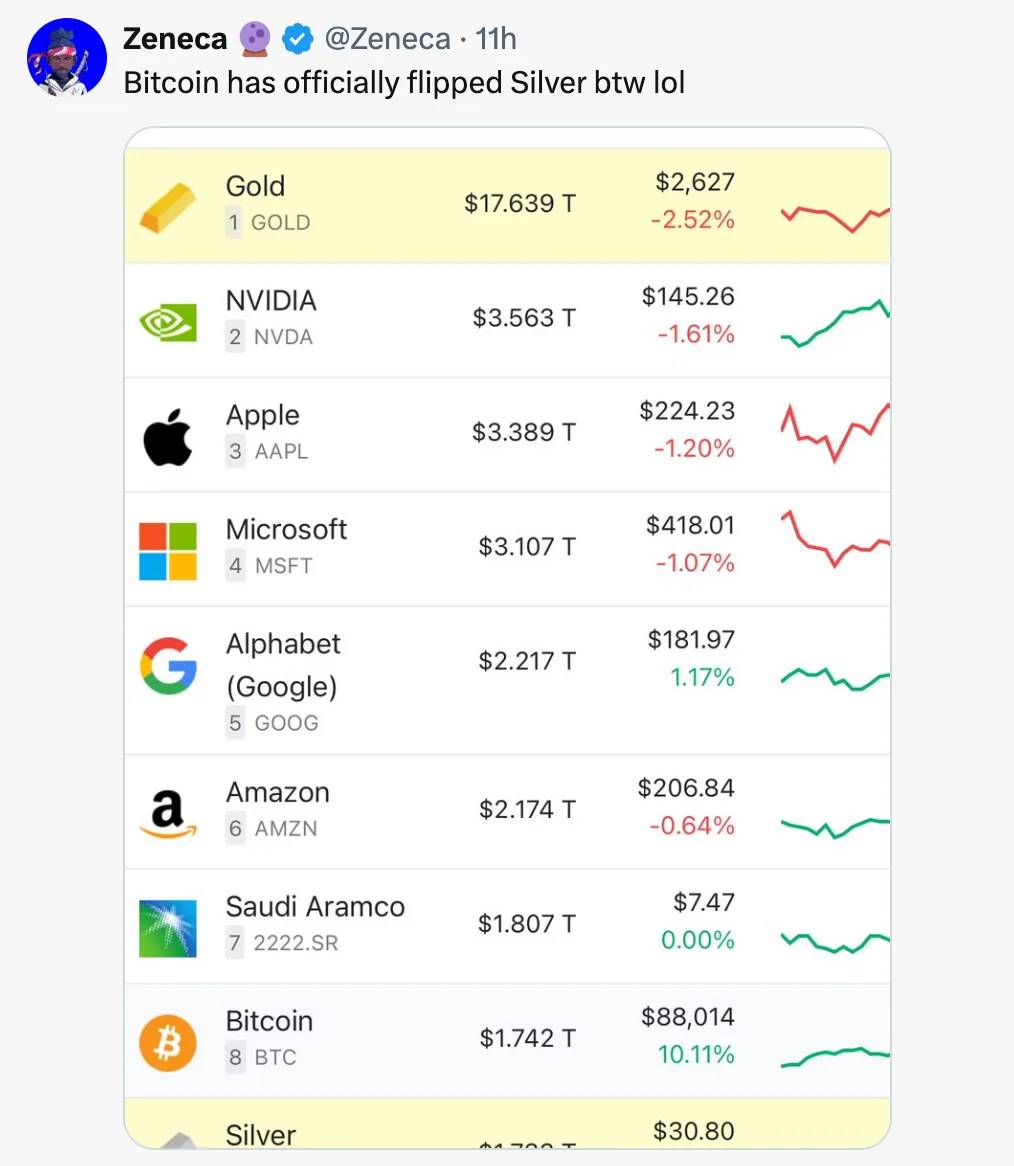
BlackRock BTC ETF now exceeds the market value of gold ETF and silver.
In terms of business:
- Coinbase shares rose 15% in premarket trading.
- MicroStrategy currently holds more than $20 billion worth of Bitcoin and has purchased an additional $2 billion worth of Bitcoin at market prices.
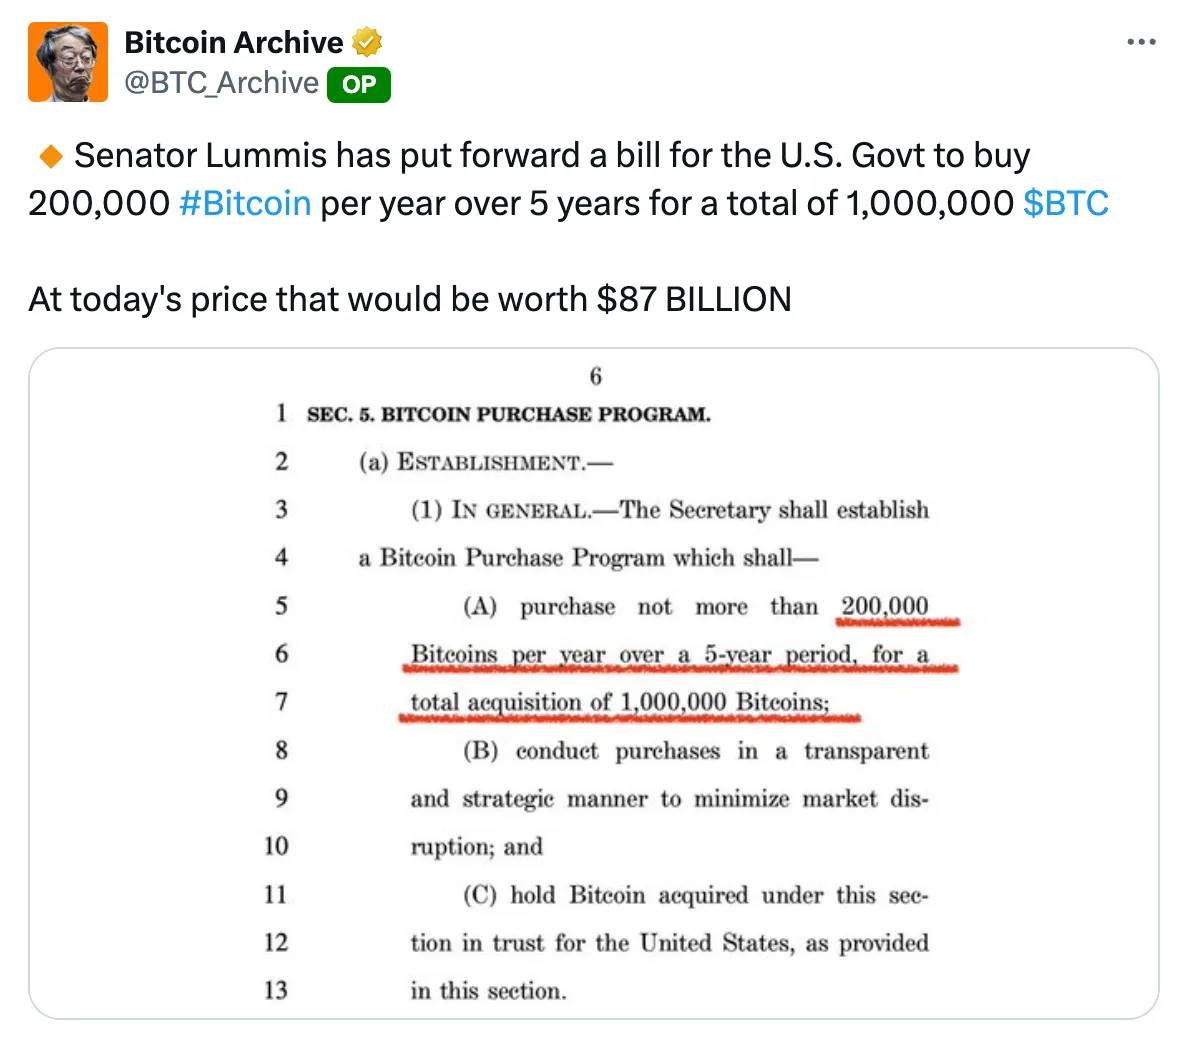
On the government side, there is a proposal that the US government purchase 200,000 bitcoins each year for the next five years, which would allow them to hold 6% of the total supply by 2030.
Currently, the United States is already the country with 213,000 Bitcoins, and the government holds 2.2% of the total supply, but this proportion may increase.
The total crypto market capitalization has reached a new all-time high of $2.9 trillion — there has never been more money in the cryptocurrency market.
Market indicators to watch:
The market dynamics have shifted from a bear market to a bull market, and investment strategies have changed to the point where most assets can only go up.
Objective indicators to watch for signs of a market turnaround:
Global liquidity (based on M2 supply)
Tracking some relevant asset or indicator - M2 Supply (3 month offset) is highly correlated with Bitcoin price.
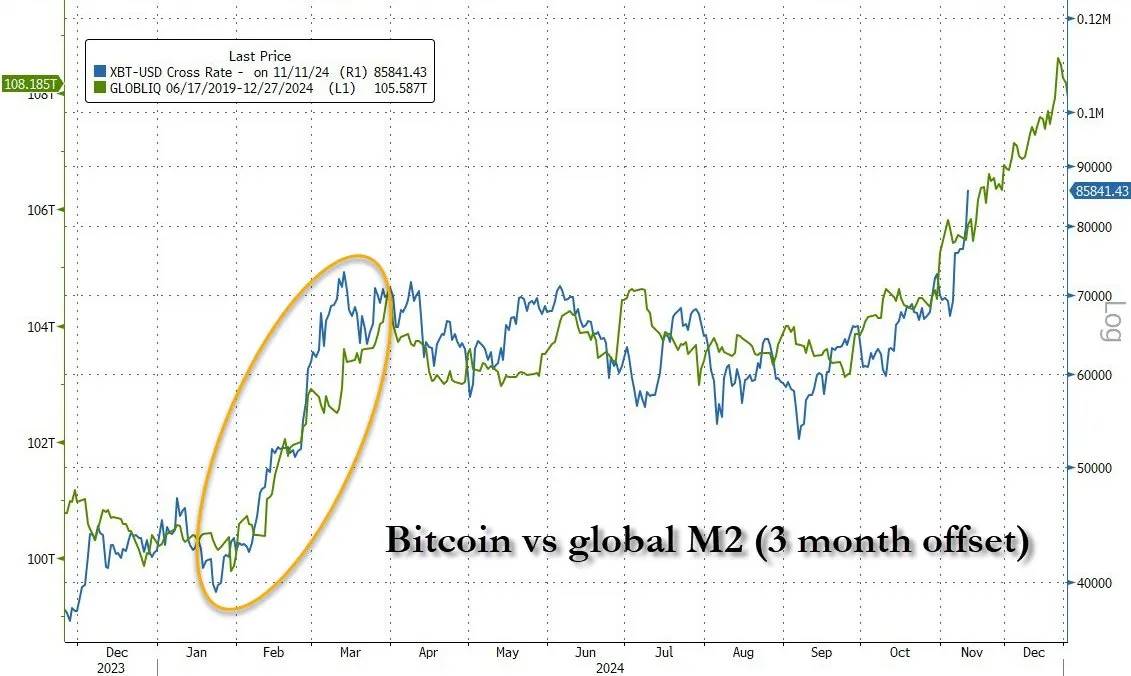
Data source: Zero Hedge.
What does this mean? This is actually a reference indicator of global liquidity. Lyn Alden and Raoul Pal's theory states that liquidity in the market becomes abundant and is invested in assets, so these economic decisions have a 3-month lag. This correlation suggests that if Bitcoin continues to track M2 and does not deviate significantly, we may see Bitcoin prices reach $100,000 by the end of the year.
Fear and Greed Index (69, Nice)
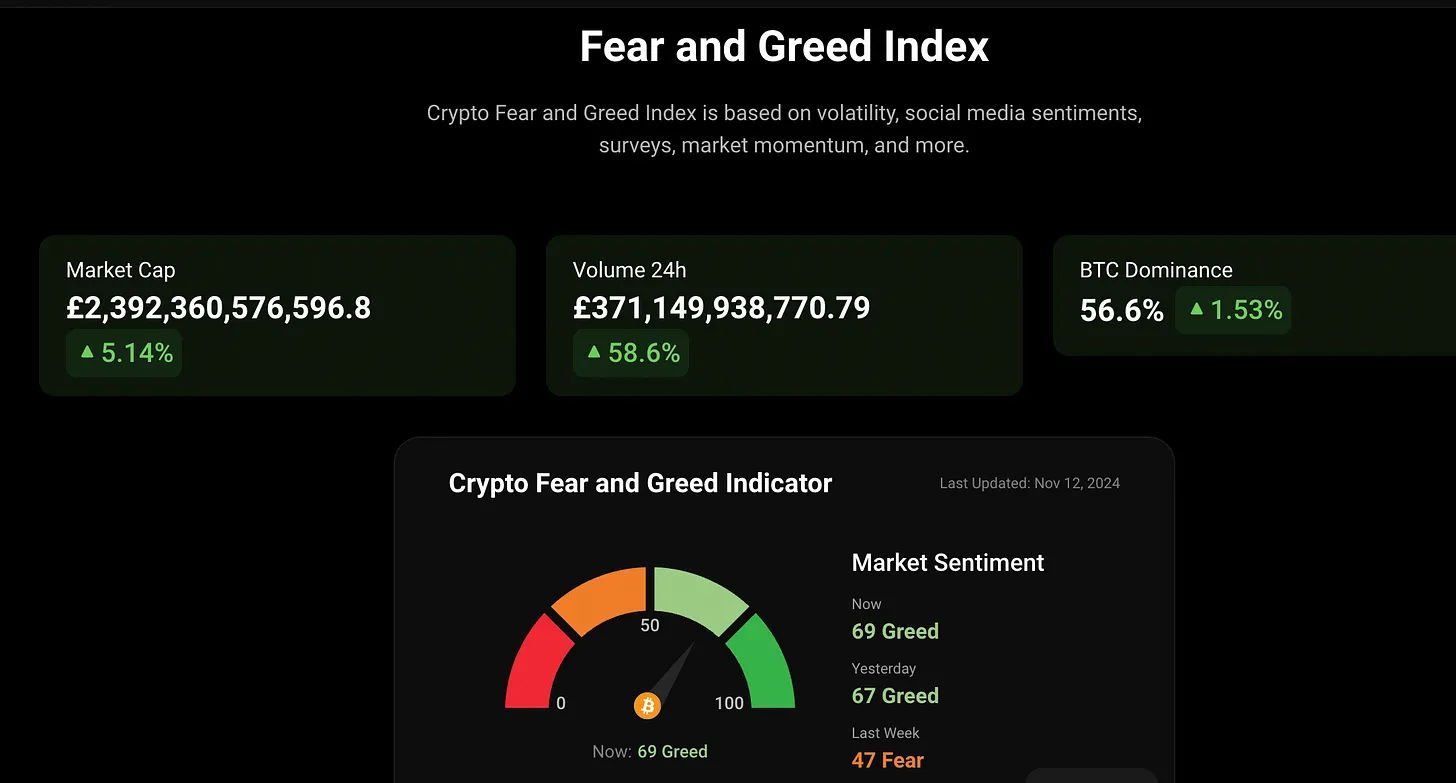
Source: Coin Glass
When using various indices, be aware of the differences in their methodology, as some are more sensitive than others. Coin Stats provides a relatively reasonable solution that matches the actual situation of the market.
Coinbase Wallet downloads increased 12% in the past 24 hours
Historically, when Coinbase becomes a popular app in the Apple Store or Google Play, this is often a significant market indicator and therefore worth keeping an eye on.
Currently, Coinbase is ranked 81st on the Apple Store.
Bitcoin's Google search trend index is "79"
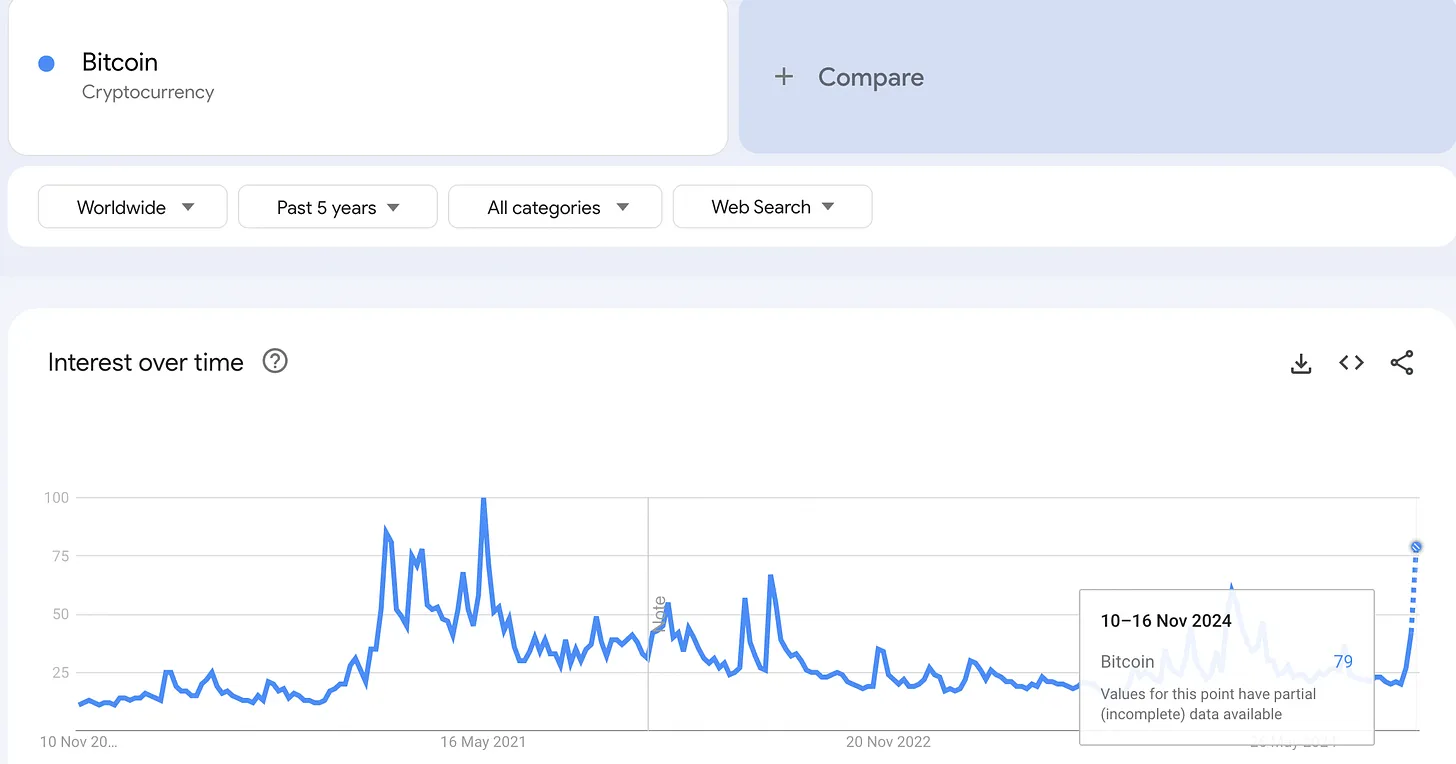
Source: Google Trends This is a metric to watch as we can’t be sure what level the “new 100” will reach - although current searches are 79% of their May 2021 peak, there could be significant growth this cycle as more users enter the crypto market.
Venture Capital Funding Levels in Crypto
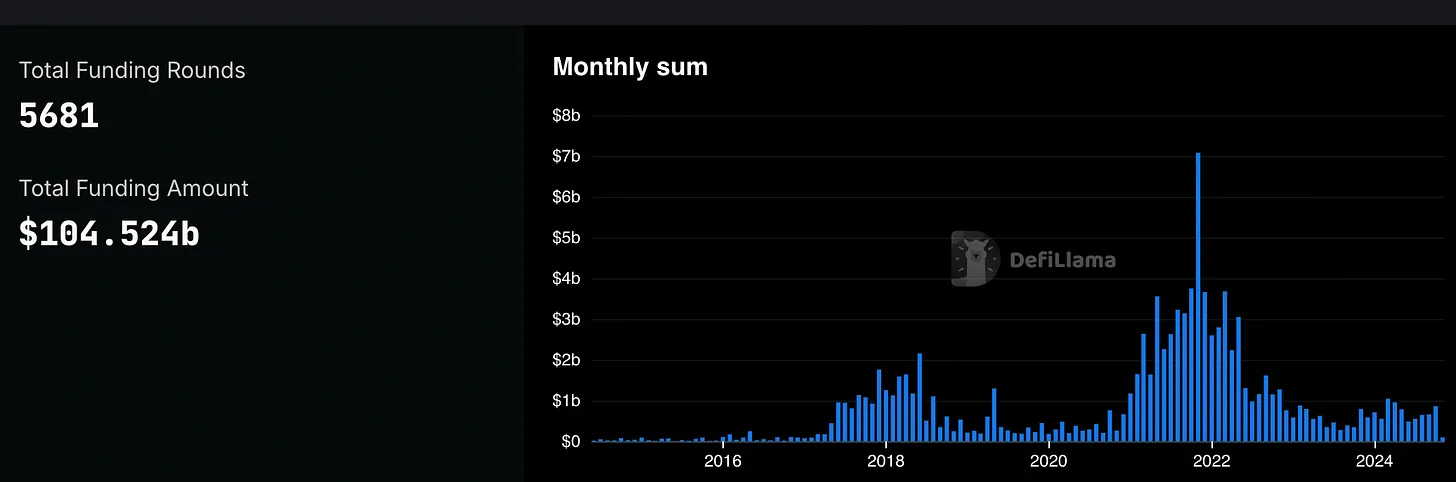
Source: Defi Llama We can at least see that the overall trend in funding is rising, so when these funding levels approach or exceed $7 billion in October 2021, it may be close to the market top. Bitcoin peaked in November 2021, which may mean that the market will lag for a few months.
Fund flows on exchanges remain neutral
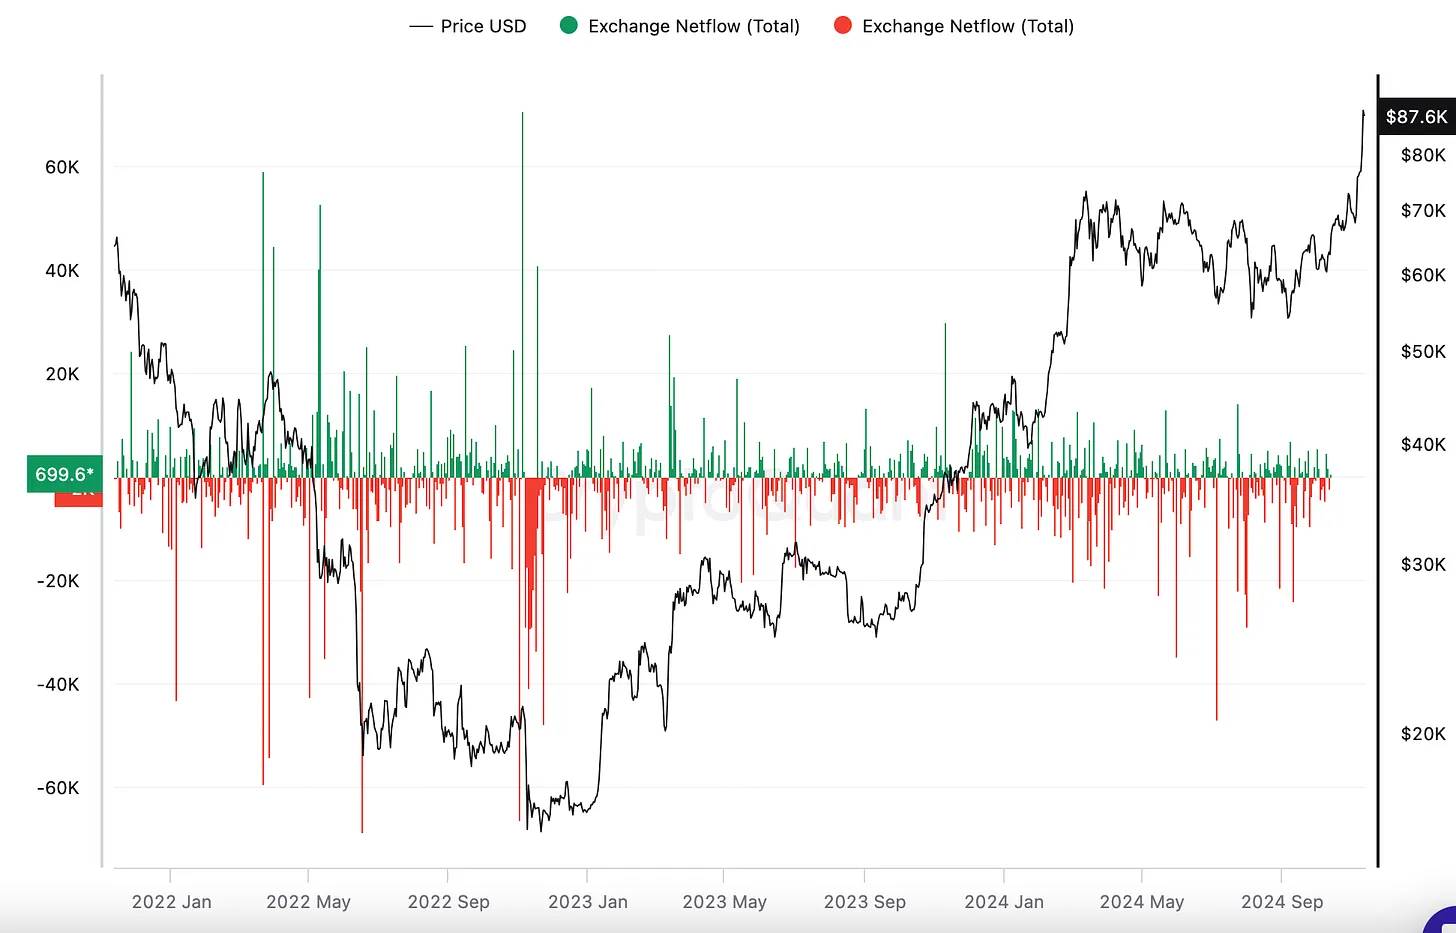
Net flows on exchanges typically fluctuate wildly during market tops or bottoms. Currently, flows remain neutral, suggesting that many investors are content to hold spot or keep their investments on-chain.
Cryptocurrency-related YouTube views
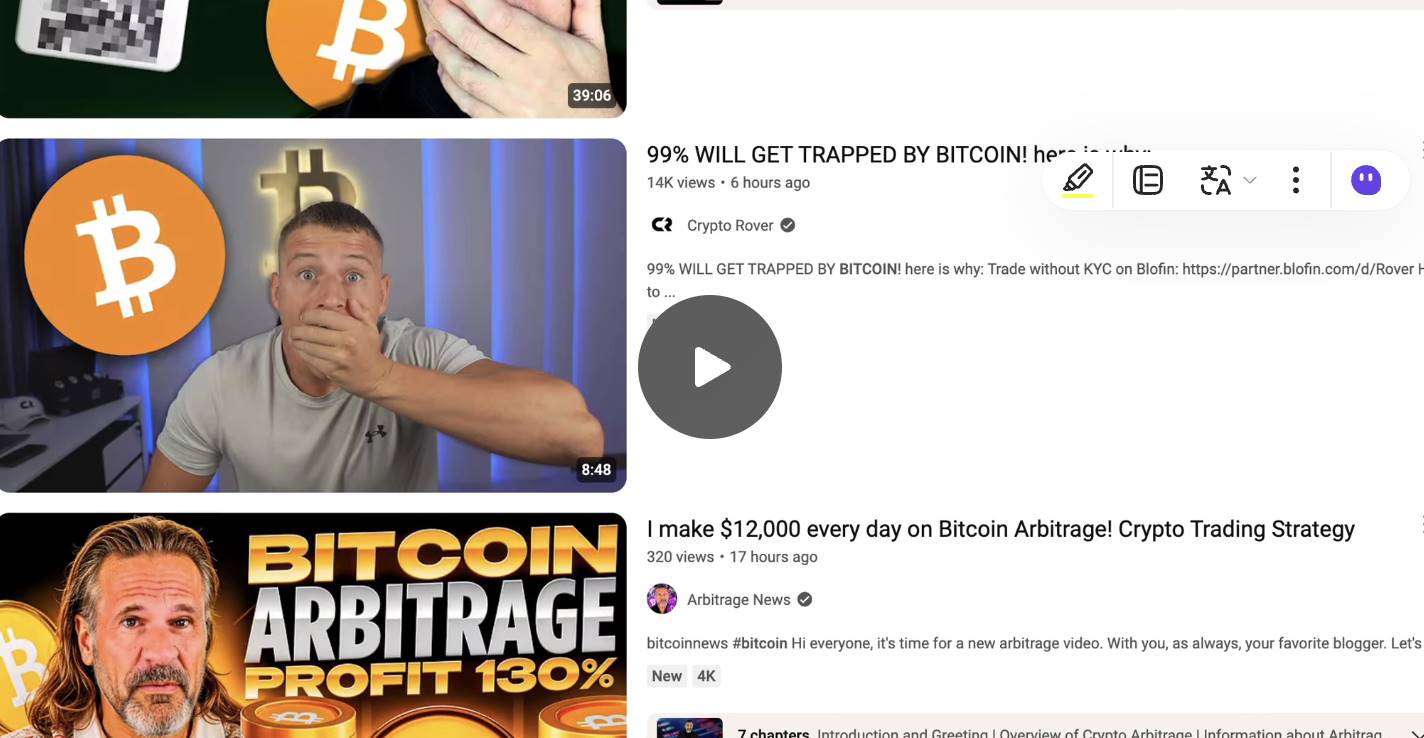
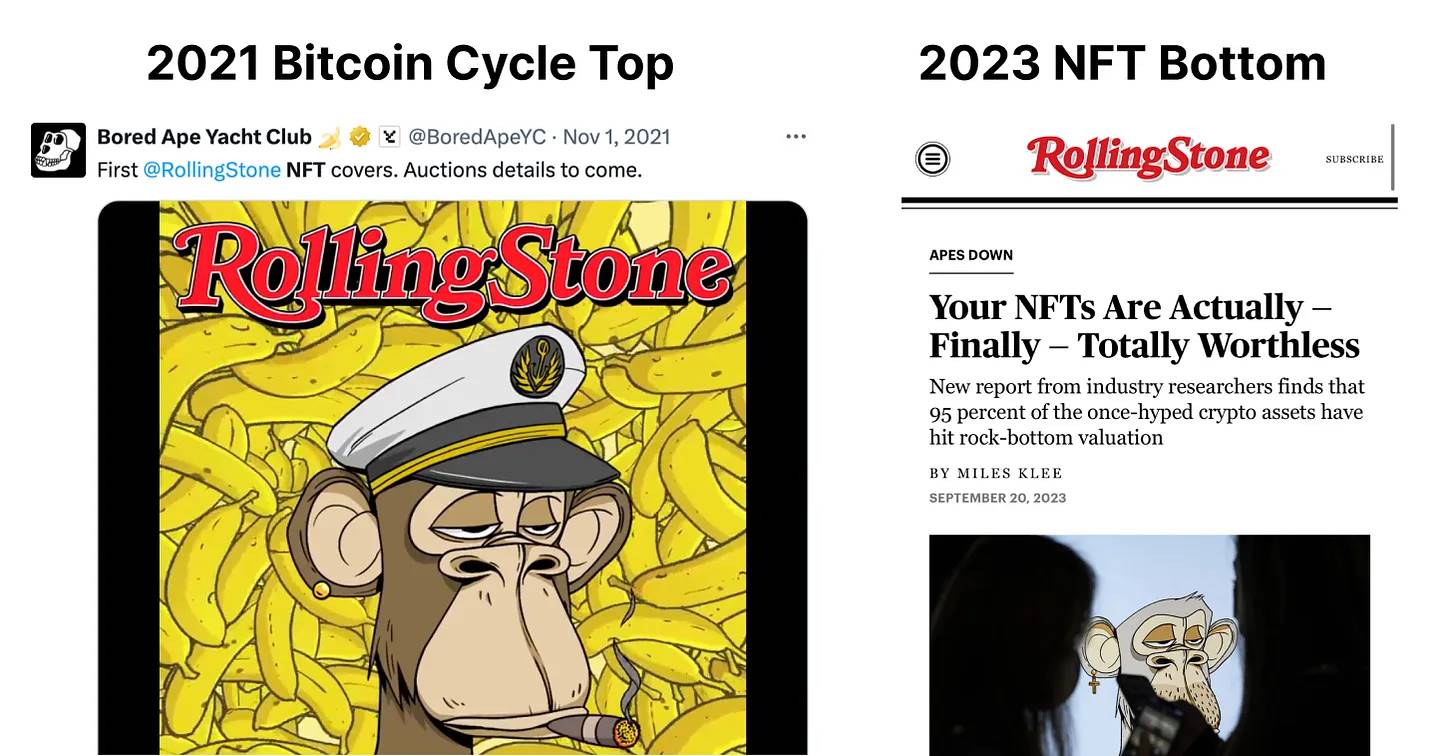
As regular traders see the popularity of Bitcoin and cryptocurrencies on major news channels, crypto channels could become a primary source of information for non-crypto users. Going the other way with mainstream media information could also be an effective strategy for selling near market tops — Rolling Stone magazine was a good indicator at the bottom of the NFT bear market.
Other indicators to watch:
- The time lag between Bitcoin’s halving event and its all-time high — the supply shock has been embedded in the market’s demand dynamics, with Bitcoin miners also holding large inventories.
- Technical analysis indicators such as RSI, Pi, and MACD suggest that certain crypto assets may be oversold or underbought.
- Market value to realized value ratio: Usually a ratio of 3.7 means a cycle top in the crypto market. The market price needs to be compared with the realized value (i.e. the weighted average of the last on-chain transaction price).
Check out the latest Modern Marketplace show for a more extensive discussion.
This content cannot be displayed outside of Lark documents for the time being
I’ll be putting together an analytics report to track these metrics over time and will provide you with weekly updates – stay tuned.
