By ah kek, Dune Analytics
Compiled by: Tim, PANews
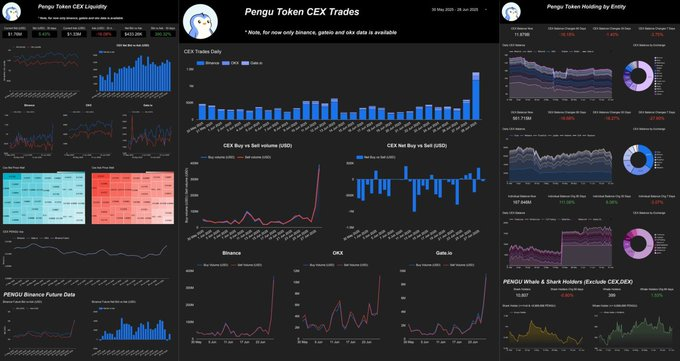
I spent a whole month organizing the centralized exchange data and on-chain holdings of PENGU tokens, and automated the data update.
Do you know why PENGU rose 80% this week?
I developed my own PENGU dashboard, which provides unparalleled real-time insights and transparent data at your fingertips.
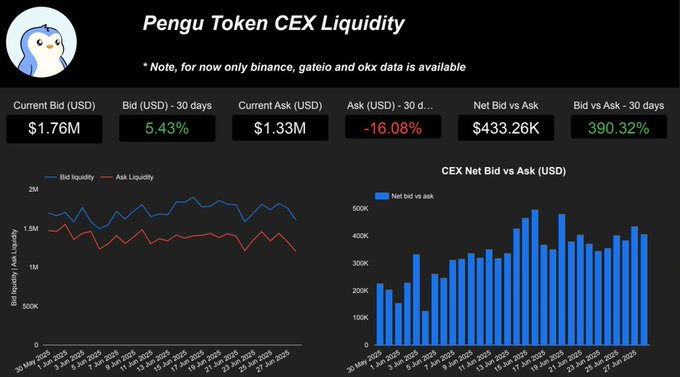
1. Buying and selling orders in major order books increased across the board
I analyzed the historical order book data of Binance, OKX and Gate. In the past 30 days, the net bid-ask spread in the market has increased by 80%, and the buy orders in the trading books have continued to rise.
Moreover, the sell order wall fell by 18%, indicating a reduction in selling pressure.
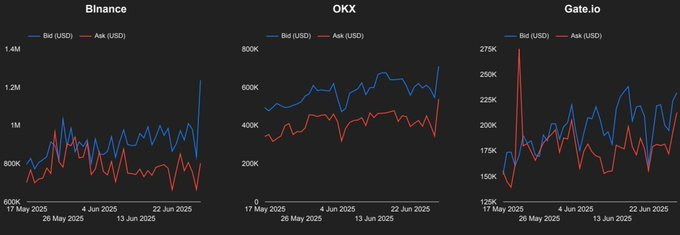
2. Centralized exchanges continue to dominate buying
According to data from the three major exchanges, a phenomenon has continued to exist over the past 30 days: the number of buy walls is significantly greater than the sell wall.
This shows sustained buying momentum and suggests buyers hold firm conviction.
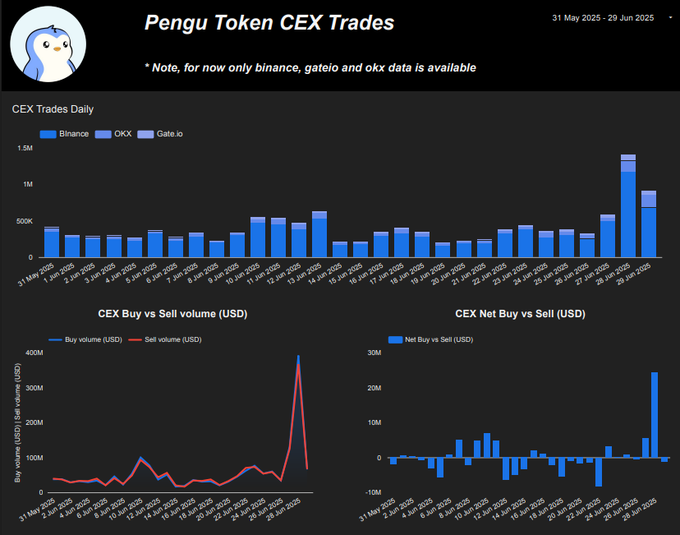
3. Volume surge on June 28
Looking at the data specifically, the net purchase amount on June 28 was as high as US$24 million.
There has been a massive surge in buying activity, which could be the catalyst for the current rally.
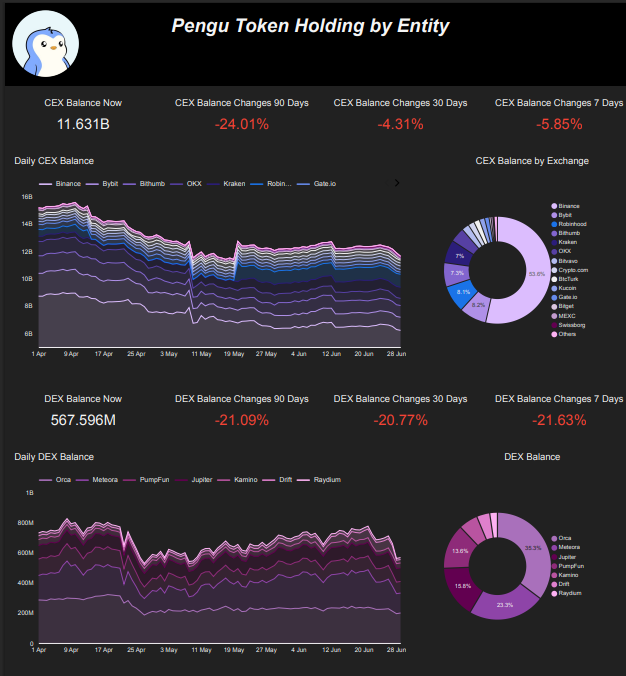
4. CEX and DEX wallet holdings
Centralized exchange holdings fell by 24%, a significant change that suggests users are moving assets to self-custodial wallets, a bullish signal on the chain.
At the same time, the holdings of decentralized exchanges saw a small decline, which may be due to position consolidation or fund transfer to cold wallets.
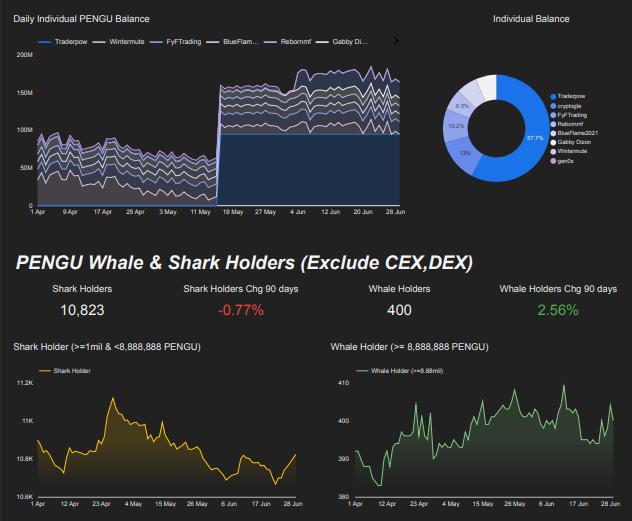
5. Individual and whale coin hoarding model
Now for the key feature: You can see exactly who is accumulating PENGU.
The most eye-catching operation? User traderpow just spent a huge amount of money to buy 94 million PENGUs. This move is simply crazy bullish.
I took great pains to make sure the numbers were accurate and everything was neat, clear, and easy to read.