
Author: David, Deep Tide TechFlow
This Thursday (Beijing time), the Federal Reserve will announce its final interest rate decision of the year. Market expectations are very consistent:
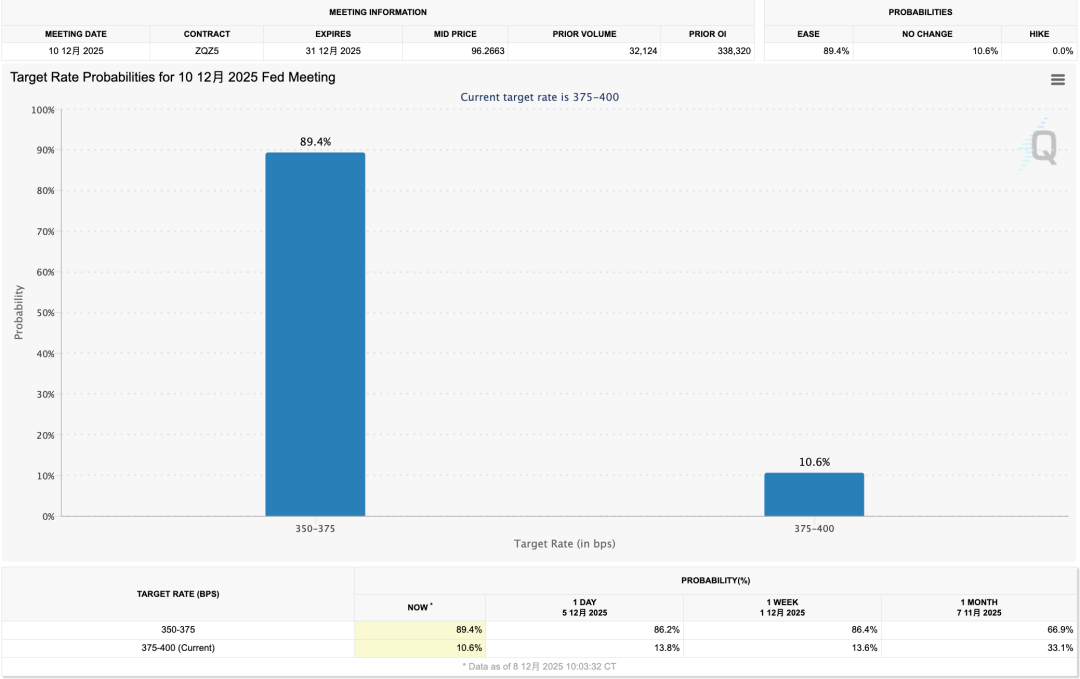
According to CME FedWatch data, the probability of a 25 basis point rate cut is over 85%.
If implemented, this would be the third consecutive rate cut since September, bringing the federal funds rate down to the 3.5%-3.75% range.
For crypto investors accustomed to the narrative that "interest rate cuts = good news," this sounds like good news.
The problem is that when everyone expects interest rate cuts, the cuts themselves cease to be a driving factor in the market.
Financial markets are expectation machines. Prices reflect not "what happened," but "what happened relative to expectations."
An 85% probability means that the rate cut has already been fully priced in; unless there are any surprises, the market will not react much when it is actually announced early Thursday morning.
So what is the real variable?
The Fed's stance for next year. A 25 basis point rate cut is almost certain, but how long the rate-cutting cycle will last and how many more cuts there will be in 2026 are the real questions the market is playing out.
Early Thursday morning, the Federal Reserve will simultaneously update its forecasts for the future path of interest rates, and these forecasts often have a greater impact on market trends than the current rate cut decision.
But there's an additional problem this time: the Federal Reserve itself may not be able to see things very clearly.
The reason is that the US federal government shut down for 43 days from October 1 to November 12. During this period, the statistics department suspended its work, resulting in the cancellation of the October CPI release and the postponement of the November CPI to December 18, a full week later than this week's FOMC meeting.
This means that Federal Reserve officials are missing inflation data from the last two months when discussing the interest rate outlook.
When decision-makers themselves are groping in the dark, the guidance they provide will be even more vague, and vagueness often means greater room for market volatility.
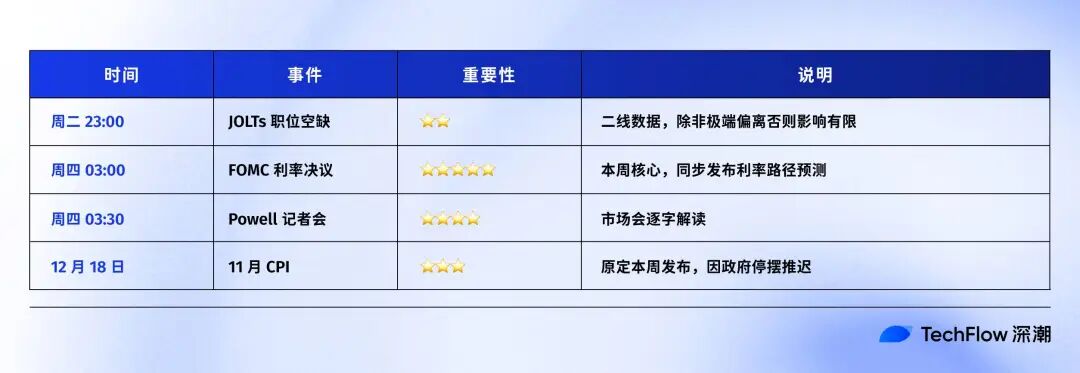
Let's take a look at this week's timeline:
Let's analyze in detail what kinds of signals the Fed might give and what kind of market reaction each would correspond to.
Expectations for next year
After each FOMC meeting, the Fed releases a "Summary of Economic Projections".
There's a chart inside showing all the Fed committee members' expectations for future interest rates.
Each committee member plots a dot, indicating where they believe the interest rate should be at the end of the year. Because it looks like a bunch of scattered dots, the market commonly calls it a "dot plot." You can find the original dot plots from previous years on the Federal Reserve's website.
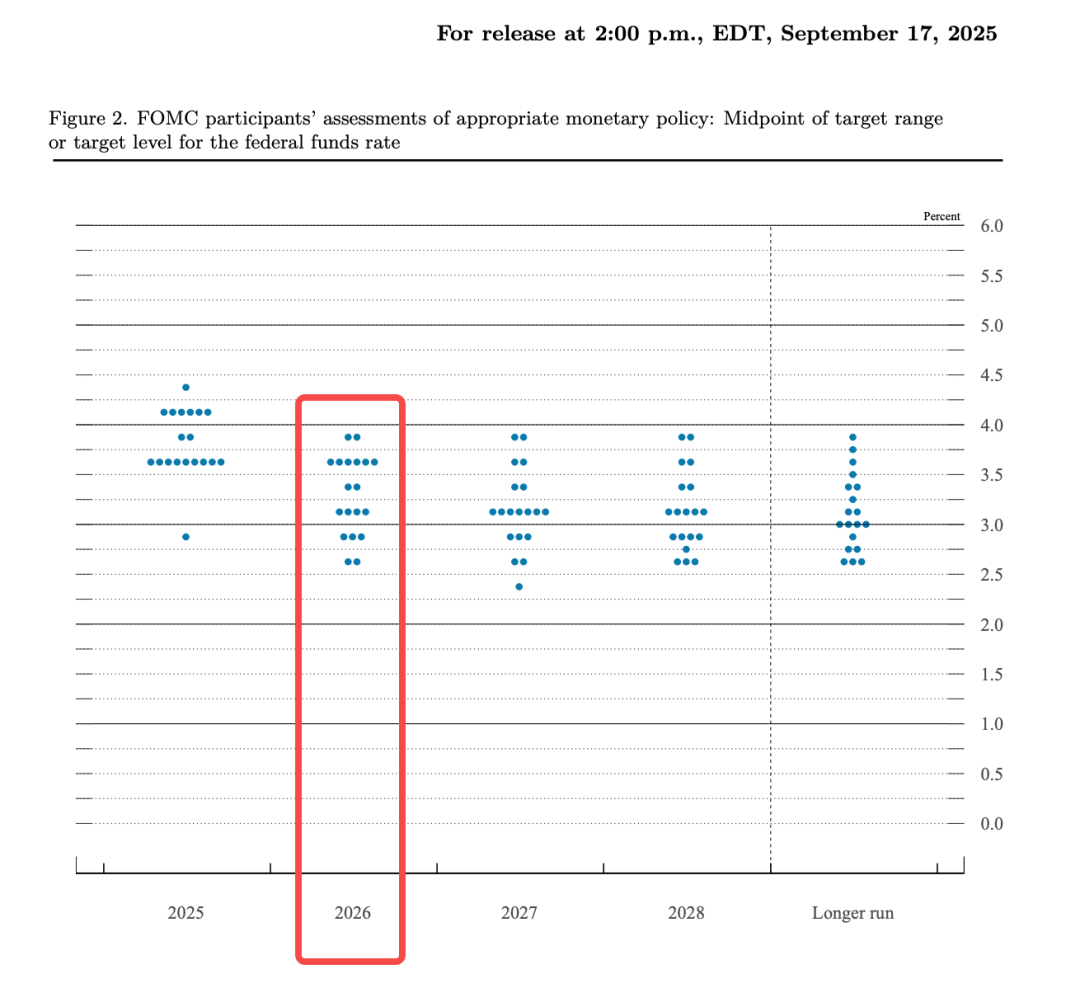
The image below is a dot plot released at the FOMC meeting on September 17.
It demonstrates the divisions and consensus within the Federal Reserve. If the points converge, it indicates that the committee members share similar views and the policy path is relatively clear.
If the points are widely dispersed, it indicates internal disputes and a future full of uncertainties.
For the crypto market, uncertainty itself is a risk factor. It suppresses risk appetite, causing funds to tend to remain on the sidelines rather than enter the market.
As can be seen from the graph, the points in the 2025 column are mainly concentrated in two areas: approximately 8-9 points around 3.5%-3.625%, and 7-8 points around 3.75%-4.0%. This indicates that the committee is divided into two factions:
One group believes there should be 1-2 more reductions this year, while the other believes there should be a pause or only one reduction. The median is around 3.6%, meaning that most people's baseline expectation is 2 more reductions by 2025 (including this week's reduction).
Looking ahead to 2026, the divisions among Fed members are even greater.
The current interest rate is 3.75%-4.00%. If it drops to around 3.4% by the end of next year, it means that there will only be 1-2 reductions throughout the year. However, judging from the chart, some committee members believe that it should be reduced to 2.5% (equivalent to 4-5 reductions), while others believe that it should be kept unchanged at 4.0% (without any reduction).
Within the same committee, the most aggressive and the most conservative forecasts differed by as much as six rate cuts. This is a highly divided Federal Reserve committee.
This split itself is a signal.
If the Federal Reserve itself is confused, the market will naturally vote with its feet. Currently, traders are betting more aggressively than official guidance. CME FedWatch shows that the market is pricing in 2-3 rate cuts in 2026, while the official dot plot only shows a median of 1.
Therefore, this Thursday's FOMC meeting is, to some extent, a "matching" between the Fed and the market. Will the Fed align itself with the market, or stick to its own pace?
Three scenarios, three reactions
Based on current information, there are roughly three possible directions for the FOMC this week.
The most likely scenario is "in line with expectations": a 25bp rate cut, the dot plot maintaining the guidance from the last September meeting, and Powell repeatedly emphasizing "data dependence" at the press conference without giving a clear direction.
In this scenario, the market is unlikely to experience significant volatility. This is because the interest rate cut has already been priced in, the guidance remains unchanged, and there is a lack of new trading signals. The crypto market will most likely follow the US stock market with minor fluctuations before reverting to its original trend.
This is also the benchmark expectation of most Wall Street institutions, including recent research reports from Goldman Sachs and Raymond James, which point in this direction.
The next possible scenario is a "dovish" stance: a 25bp rate cut, but the dot plot suggests two or more cuts in 2026. Powell's wording is relatively soft, emphasizing that labor market risks outweigh inflation risks.
This is tantamount to the Fed aligning with market expectations and confirming its easing path. A weaker dollar will boost dollar-denominated assets, while improved liquidity expectations will lift market sentiment. BTC and ETH may follow the rebound in US stocks, with the former potentially testing recent highs.
The less likely but not ruleable scenario is a "hawkish" stance: although the rate cut was 25bp, Powell emphasized inflation stickiness, suggesting limited room for further rate cuts next year; or multiple dissenting votes indicate internal resistance to continued easing.
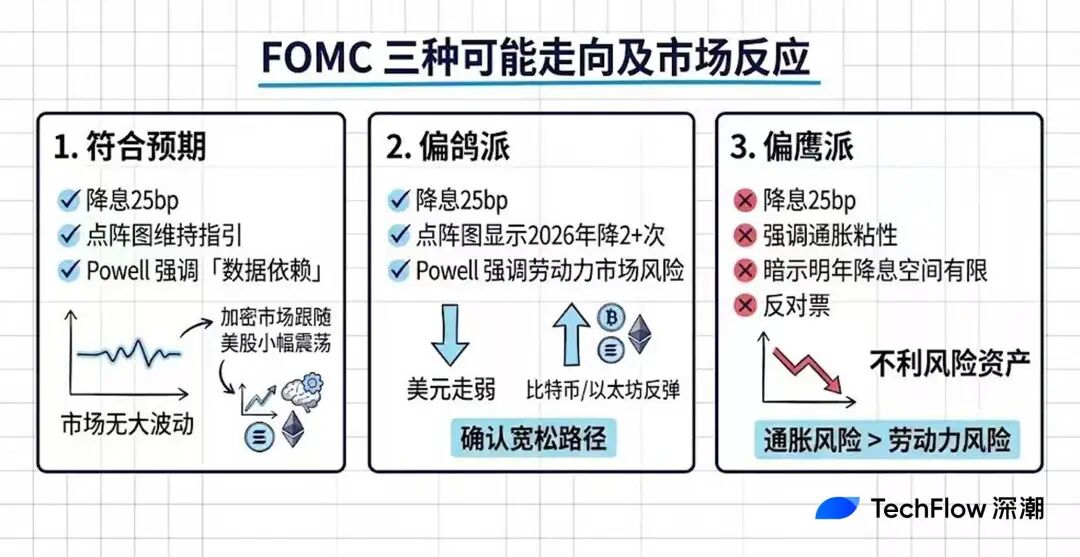
This is tantamount to telling the market, "You're overthinking it." A stronger dollar and tightening liquidity expectations are putting pressure on risk assets. The crypto market may face a short-term correction, especially for high-beta altcoins.
However, if the wording is merely hawkish rather than a substantial policy shift, the decline is often limited and may even present an entry opportunity.
Normally, the Fed adjusts the dot plot based on the latest data. However, this time, due to the government shutdown, they lacked two months' worth of CPI data and could only make judgments based on incomplete information.
This has led to several chain reactions. First, the reference value of the dot plot itself has been reduced; even the committee members themselves are unsure whether the dots they draw will be more scattered.
Secondly, Powell's press conference carries more weight, and the market will scrutinize every word he uses for direction. If the dot plot's indications contradict Powell's tone, the market will be more confused, and volatility may be amplified.
For crypto investors, this means that market movements in the early hours of Thursday may be more difficult to predict than usual.
Instead of betting on the direction, focus on the volatility itself. When uncertainty increases, controlling your position size is more important than betting on whether the market will rise or fall.
Tonight's job opening data isn't as important as you think.
We've been talking about Thursday's FOMC, but there's another data release tonight (Tuesday 23:00 Beijing time): JOLTs.
Occasionally, people on social media exaggerate its importance, claiming it "quietly determines the direction of liquidity." But frankly, JOLTs don't carry significant weight in macroeconomic data. If you're short on time, just keep an eye on Thursday's FOMC meeting;
If you'd like to learn more about the background of the labor market, please read on.
JOLTs stands for Job Openings and Labor Turnover Survey. It is published monthly by the U.S. Bureau of Labor Statistics (BLS) and tracks how many jobs are open, how many people have been hired, and how many people have left the company.
The most attention-grabbing number is "job openings": the higher the number, the stronger the demand for recruitment from companies and the tighter the labor market.
At its peak in 2022, this number exceeded 12 million, meaning that companies were aggressively recruiting and wages were rising rapidly, which the Fed worried would push up inflation. Now, this number has fallen back to around 7.2 million, basically returning to pre-pandemic levels.
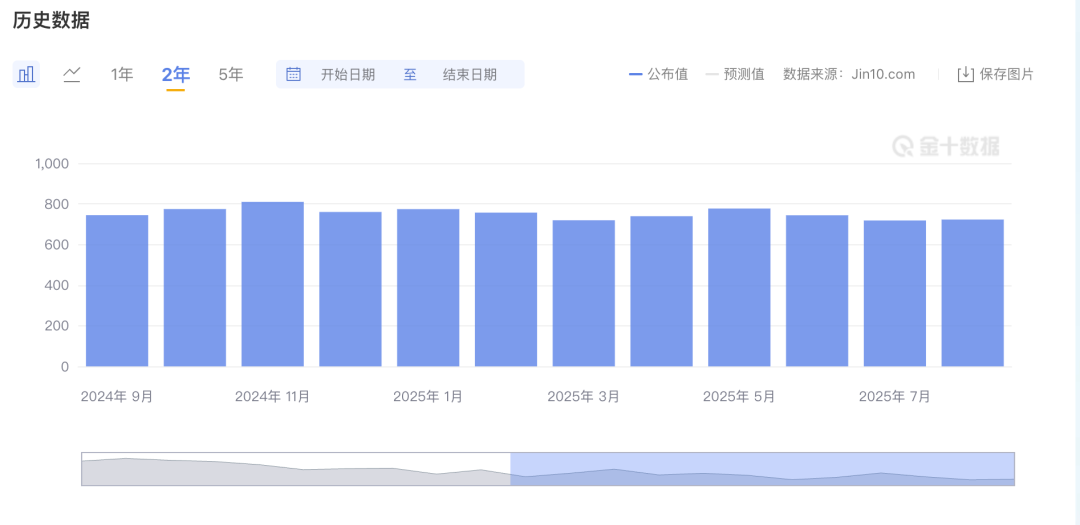
Image source: Jinshi Data
Why is it said that the importance of this data might be overestimated?
First, JOLTs are lagging indicators. Today's data is from October, but it's already December. The market pays more attention to more timely data, such as weekly initial jobless claims and the monthly non-farm payroll report.
Secondly, the expected number of job vacancies of around 7.1 million is not considered "overheated." Analysts previously pointed out that the ratio of job vacancies to the unemployed population had already fallen below 1.0 in August, meaning that there is currently less than one job opening for every unemployed person.
This is completely different from the situation in 2022 where "one unemployed person had two jobs." The narrative of an "overheated" labor market is outdated.
According to predictions from LinkUp and Wells Fargo, the October JOLTs, to be released tonight, will most likely be around 7.13-7.14M, not much different from the previous 7.2M.
If the data meets expectations, the market will likely not react; this merely confirms the existing narrative that the labor market continues to cool slowly and will not change anyone's expectations of the Fed.
Tonight's data is more like an "appetizer" before the FOMC meeting; the real main course will be on Thursday morning.
What will happen to my BTC?
The previous chapters have all discussed macroeconomic data, but you might be more concerned about one question: how exactly do these things affect the BTC and ETH I hold?
In conclusion, it will have an impact, but it's not as simple as "interest rate cut = price increase".
The Fed's interest rate decisions influence the crypto market through several channels.
First is the US dollar. Interest rate cuts mean lower returns on dollar-denominated assets, causing funds to seek other destinations. When the dollar weakens, dollar-denominated assets (including BTC) tend to perform better.
Secondly, there's liquidity. In a low-interest-rate environment, borrowing costs are low, and there's more money in the market, some of which flows into risky assets. The bull market of 2020-2021 was largely a result of the Fed's unlimited quantitative easing.
Third is risk appetite. When the Fed sends dovish signals, investors are more willing to take risks, and funds flow from bonds and money market funds to stocks and cryptocurrencies; conversely, hawkish signals cause funds to flow back to safe-haven assets.
These three channels together form a transmission chain of "Fed policy → US dollar/liquidity → risk appetite → crypto assets".
In theory, BTC now has two popular identities: "digital gold" or "risk asset".
If it's digital gold, it should rise during market panics, just like gold, and be negatively correlated with the stock market. If it's a risky asset, it should rise and fall with the Nasdaq, and perform well during periods of ample liquidity.
In reality, BTC has resembled the latter more in the past few years.
According to CME research, starting in 2020, the correlation between BTC and the Nasdaq 100 jumped from near zero to around 0.4, and sometimes even exceeded 0.7. The Kobeissi Letter recently pointed out that BTC's 30-day correlation once reached 0.8, the highest level since 2022.
However, an interesting phenomenon has recently emerged. According to a report by CoinDesk, the correlation between BTC and Nasdaq has dropped to -0.43 over the past 20 days, showing a clear negative correlation.
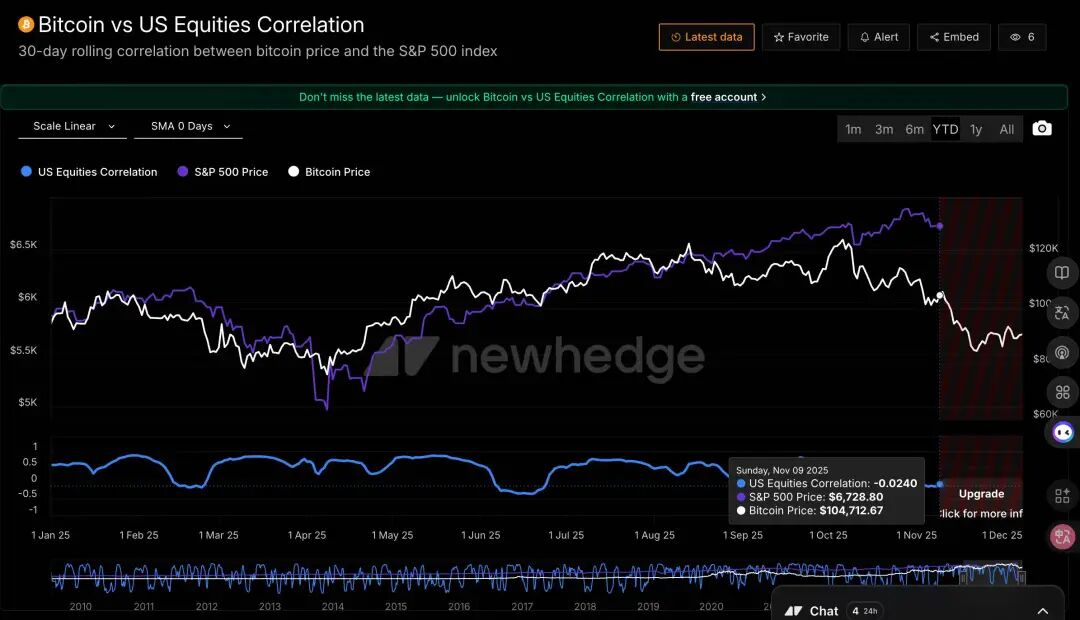
Data source: https://newhedge.io/
The Nasdaq is only 2% away from its all-time high, while BTC has fallen 27% from its October high.
Market maker Wintermute offers an explanation: BTC currently exhibits a "negative skew," falling more when the stock market falls and reacting sluggishly when the stock market rises. In their words, BTC "only shows high beta in the wrong direction."
what does that mean?
If the FOMC releases dovish signals this week and US stocks rise, BTC may not rebound in tandem; however, if it releases hawkish signals and US stocks fall, BTC could fall even more sharply. This is an asymmetric risk structure.
Summarize
Having said all that, here's a framework for continuous tracking.
What should we pay attention to this week (December 9-12)?
The core focus is the FOMC meeting early Thursday morning. Specifically, watch three things: whether the dot plot changes, especially the median interest rate forecast for 2026; whether Powell's press conference wording leans dovish or hawkish; and whether there are multiple dissenting votes.
What should we pay attention to in mid-to-late December?
The November CPI will be released on December 18th. If inflation data rebounds, the market may repric its expectations for interest rate cuts next year, at which point the Fed's narrative of "continuing easing" will be challenged.
What to focus on in Q1 2026?
First, there's the change in the Fed chairmanship. Powell's term expires in May 2026.
Secondly, there is the ongoing impact of Trump's policies. Further expansion of tariffs could continue to push up inflation expectations and limit the Fed's room for easing.
In addition, continue to monitor whether the labor market deteriorates rapidly. If layoffs begin to rise, the Fed may be forced to accelerate interest rate cuts, which would be a completely different scenario.
