Author: 0xBrooker
Following the interest rate cut in September, BTC launched an upward surge in early October, reaching a new all-time high of $126,296.00 on October 6th. Since then, BTC has suddenly reversed course, with slower capital inflows, continuous selling by holders, and the price forced to rebalance downwards. As of this week, BTC has fallen by as much as 21%, reaching a moderate level of correction in this bull market (the extreme level is around 30%).
Technically, BTC has broken below the 200-day moving average it held above last week, falling back into the "Trump bottom" (US$90,000-110,000). Most seriously, the price of BTC has fallen to the lower edge of the upward channel established since November 2022 in this bull market. This lower edge coincides with the 360-day moving average, making it crucial for long-term investors. The struggle around this price level will undoubtedly be very difficult.
If this support level is broken, BTC will technically complete the "bull-bear" transition and officially enter a "downward phase".
Policy, macro-financial and economic data
As highly volatile emerging assets, BTC and crypto assets are most responsive to macro liquidity and risk appetite. This has been particularly evident in this round of adjustments.
The first wave of selling, which began on October 10th, was triggered by Trump's announcement on social media that he would impose another 100% tariff on China. This sell-off sparked the "Binance USDe" incident, causing significant damage to the internal structure of the cryptocurrency market.
The second round of selling on November 3, which began this week, was caused by hawkish comments from Federal Reserve officials (reducing the probability of a December rate cut) and the US liquidity crisis caused by the impending record-breaking US government shutdown.
During this period, due to the US government shutdown and the difficulty in carrying out spending, the balance of the Federal Reserve's TGA account continued to reach record highs.
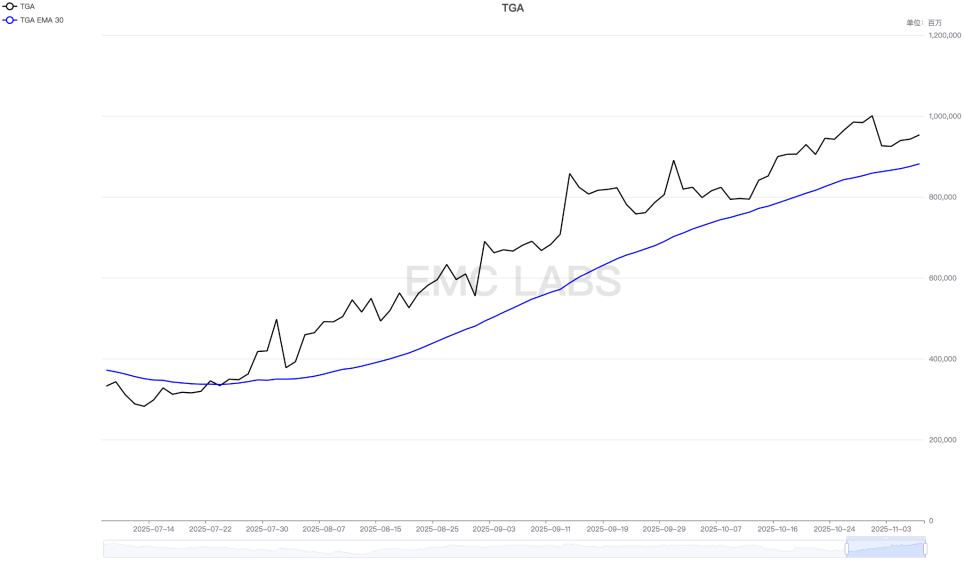
Market liquidity was continuously "drained," with the SOFR (Social Exchange Rate of Return) briefly exceeding 4.3% (October 28), far higher than the federal funds rate, indicating very tight liquidity in the banking sector. The US dollar index rose to 100.364 at one point (November 5).
Under heavy pressure, risky assets have been passively driven down in valuation. This past week, the Nasdaq experienced its worst week since April, falling 3.04% for the week.
Due to the US government shutdown, government-related economic and employment data cannot be released in a timely manner, so the market can only focus on relevant data released by the private sector.
ADP data released on Wednesday showed that the US job market showed signs of stabilizing after two consecutive months of decline. US ADP employment increased by 42,000 in October, significantly exceeding the expected 30,000 and reversing the previous month's decrease of 32,000 (revised to 29,000). This adds uncertainty to whether the Federal Reserve will continue to cut interest rates in December.
The University of Michigan's consumer sentiment index, released on Friday, showed that consumer confidence in November hit a more than three-year low and the second lowest since records began in 1978. This provides some support for a December interest rate cut.
Last week, comments from Federal Reserve officials suggested that a December rate cut was uncertain. A week later, FedWatch data shows the probability of a December rate cut has dropped by more than 30%, currently standing at 66.9%.
Regarding the federal government shutdown, Democrats presented clear conditions this week, which Republicans failed to pass. The market viewed this "condition presentation" as a significant breakthrough towards a shutdown. Friday's sharp V-shaped recovery in US stocks and Bitcoin was a positive response to this development. Trump also proposed using the "repeal of the rule against obstruction of proceedings" to end the dispute, pass the appropriations bill by a "simple majority," and immediately restart the government. Over the weekend, the Senate held intensive meetings, and by Sunday, reports emerged of clearer progress in the "peace talks."
Both sides are nearing their limits. Goldman Sachs predicts the US government shutdown will end within two weeks.
We believe the current correction in the US stock market is fundamentally due to the decreased probability of a medium-term interest rate cut and the liquidity crunch caused by the recent federal government shutdown. The shutdown issue may be resolved within one to two weeks, but whether another interest rate cut will occur in December will depend on the economic and employment data released after the shutdown ends.
Volatility and uncertainty remain the main themes of the market in November. However, expectations are approaching a turning point.
Crypto Market
BTC fell sharply by 5.28% this week, but rebounded on Sunday, closing at 104,694.95 with increased trading volume.
Technically speaking, the price broke below the $100,000 mark during Tuesday's sharp drop and fluctuated around this price for most of the remaining time. This price also coincides with the 360-day moving average. This price is also the lower edge of the upward channel we've been monitoring for this bull market. If the price breaks below this level, technically, this round of the BTC bull market will officially end.
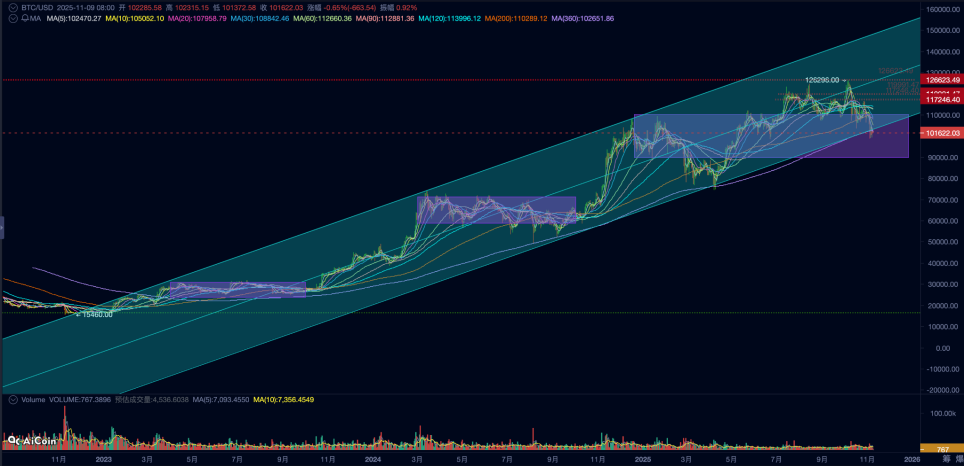
BTC daily chart
The adjustment in market risk appetite is ultimately reflected in a decrease in capital inflows and an increase in selling.
In the past week, a total of 170,602 BTC were transferred to exchanges by both long and short positions. The selling volume has increased for three consecutive weeks, while the buying volume has failed to increase effectively, resulting in a slight outflow of 967 BTC from exchanges.
Looking at the funding side, outflows reached $2.06 billion this week, continuing the upward trend from last week. Among different asset classes, only DATs saw a slight inflow, while BTC Spot ETFs and stablecoins experienced significant outflows. This outflow is, of course, already factored into the BTC price. In September 2024 and April 2025, both periods saw severe weekly outflows across all market channels. Subsequently, as negative factors reached a turning point, inflows reversed, leading to a new round of price increases. However, if inflows fail to materialize, historical data would confirm the arrival of a bear market.
Long-term holdings, monitored for cyclical characteristics, saw a significant drop of nearly 120,000 contracts this week, indicating that this group still believes the bull market cycle has ended and is responding to both rises and falls with selling. During the corrections in September 2024 and April 2025, long-term holdings also exhibited increased selling near the bottom of these phases – this can be interpreted as a weeding out of relatively weak-willed long-term holders. Against the backdrop of significant market structural changes, is this increased selling pressure a clearing out of this group, or the right decision to completely extinguish the cyclical bull market?
In terms of magnitude, the 21% drop is still within the normal correction range of this cycle (around 30%), but the price has fallen to several key technical indicators such as the 360-day moving average and the lower edge of the upward channel trend line. Technically speaking, this round of BTC bull market has reached a critical moment where its fate hangs in the balance.
The results will be available within the next 1-2 weeks. Alternatively, liquidity may return as the government resumes operations, leading to another rebound (the end of the old cycle will require more time for confirmation within the market); or even if liquidity recovers, the returning funds may struggle to withstand selling pressure, causing BTC prices to gradually decline and enter the next stage of the old cycle – the "downtrend" (bear market).
Cyclical Indicators
According to eMerge Engine, the EMC BTC Cycle Metrics is 0, indicating a transition period.