
Original text by David Lin
Compiled & edited by: Yuliya, PANews
Global financial markets are at a critical juncture. The artificial intelligence boom is driving stock markets to new highs, but high levels of government debt and interest rate uncertainty continue to pose risks. Are we in a "bubble of everything"? And when will this bubble burst? To answer these questions, renowned YouTuber David Lin invited Dr. Richard Smith, Chairman and Executive Director of the Foundation for Cycle Research (FSC), to this episode. Dr. Smith uses his profound cycle analysis theory to dissect the future trends of core assets such as Bitcoin, gold, stocks, and global debt. He believes that market liquidity is at the heart of all current problems, and the "fiscal-led" strategy adopted by the US government to maintain low interest rates is profoundly impacting every corner, from cryptocurrencies to traditional stock markets. More importantly, he gives a clear timeline prediction: a deeper crisis triggered by debt may arrive by mid-2026. PANews has compiled and translated the conversation.
Is Bitcoin about to bottom out? It all comes down to "fiscal dominance" and liquidity.
Host: Bitcoin has experienced extreme volatility in recent weeks, falling from its highs to around $80,000 at one point, far below the peak reached last year. Many are discussing whether Bitcoin's four-year cycle has ended, or whether the "halving" narrative will remain the primary driver of price as it has in recent years. What are your thoughts on Bitcoin's current state and future trajectory?
Richard: Bitcoin reveals many deep-seated problems in the current market. Our foundation has been closely monitoring Bitcoin. Based on our cycle detection technology, we clearly pointed out when Bitcoin's price previously peaked that the market would undergo a correction.
This doesn't mean it won't reach new highs. I want to emphasize that Bitcoin's price reacts most quickly to the amount of money (i.e., liquidity) in the entire financial system. Therefore, its price changes can be seen as an early signal of the overall market situation. An analyst named Michael Howell explained this well, saying that the core of today's market is actually "debt refinancing." We might think that the stock market's performance depends on company business, and cryptocurrencies depend on technological innovation, which makes some sense, but the more important fact is that we live in a "fiscal-driven" era . This means that the US government has a huge debt and must constantly borrow new money to repay old debt. But if interest rates are too high, the government will have to pay too much interest, which it cannot afford. Therefore, the most important task for the US government at present is to do everything possible to keep interest rates low. This need to manage debt is now the most important force affecting all financial markets.
Let me demonstrate this using our cycle analyzer.
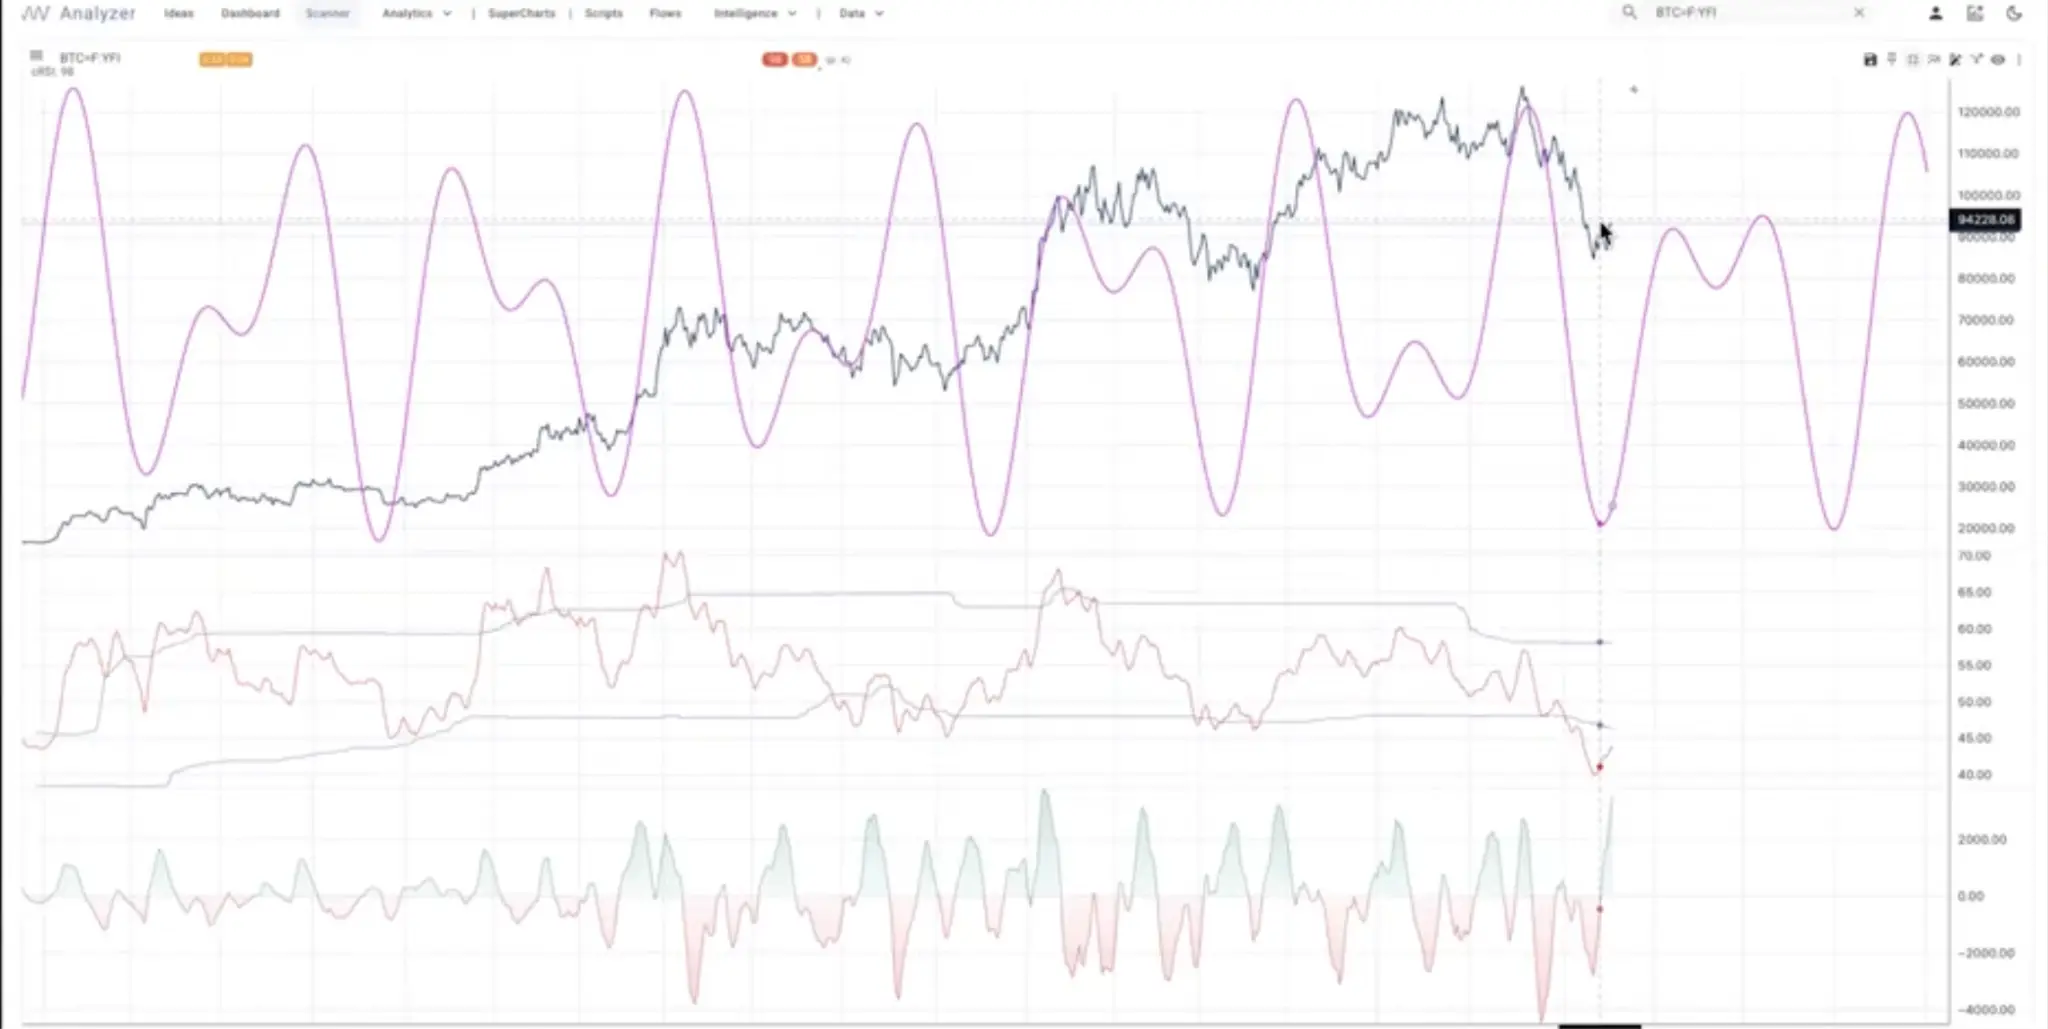
The blue line represents the price of Bitcoin. We saw a high of approximately $125,000 in October 2025, and our cycle model predicted a pullback at that time. Currently, this pullback appears to be nearing its end. I need to clarify that cycle analysis tells us the "wind direction," it's not the only decisive force in the market, but we must know which way the wind is blowing.
Currently, cyclical models indicate that Bitcoin is searching for a bottom. Furthermore, several fundamental factors support this view. The Federal Reserve recently stated clearly at its meeting that it is prepared to stop quantitative tightening (QT) (PANews note: the Fed stopped QT on December 1st). This is a very important signal because:
- Money market funds no longer borrow money from the Federal Reserve
- They can't get interest.
- Liquidity in the system has become too tight.
When liquidity becomes too tight, the Federal Reserve must stop QT and begin injecting liquidity—meaning that a "hidden version of quantitative easing (QE)" is about to return . The Fed must inject more liquidity into the system. They have made it clear that they will no longer simply roll over maturing Treasury bonds onto their balance sheet, but will instead purchase new short-term Treasury bonds to replace the old ones.
Currently, the Treasury is primarily selling short-term Treasury bonds to maintain financing, as they cannot afford the high interest rates on long-term debt. All of this tells me that Bitcoin, as the most liquidity-sensitive asset, has bottomed out cyclically, coinciding with news we've heard about interest rate cuts, the possibility of a more dovish new Fed chairman than Powell, and the return of expectations for a December rate cut. Behind all this lies the core mission of the US government: to keep the entire system running, because the dollar and US debt are "too big to fail."
Host: Richard, I have some data here from the prediction market Kalshi. Regarding the question of whether Bitcoin can break $100,000 again this year, market participants are currently roughly split. As a cycle analyst, what is your view on this issue?
Richard: I haven't done in-depth research on prediction markets, and compared to the trillion-dollar Bitcoin market, $1.45 million in trading volume isn't that large. But for me, the most crucial thing is:
- Accurate cycle top signals : Our cycle model accurately predicts previous tops.
- Cyclical pressure has been released: The model shows that the downward pressure from the cycle has been largely released, and now is a typical time for market participants to change their views.
- Market sentiment is pessimistic : We are seeing a lot of negative news about Bitcoin, such as the sharp pullback in the stock price of Michael Saylor's Strategy, which is usually a signal that market sentiment has bottomed out.
- Improved macro liquidity : The Federal Reserve has stopped QT and may turn to some form of "hidden QE," which is good for liquidity and will benefit Bitcoin in the long run.
We are about to enter the most seasonally bullish period of the year (the last few weeks of December and the first week of January) . I do not expect a major financial crisis to erupt in the next 6 to 8 weeks. Overall, all of this points to liquidity starting to return to the system, supporting assets such as stocks, Bitcoin, and Ethereum. As for whether new all-time highs will be reached, stocks may have a chance, but Bitcoin remains to be seen.
Macroeconomic Debt Cycle and Outlook for Gold and the US Dollar
Host: This leads to my next question: Are market cycles independent of macroeconomic conditions? For example, most traders are currently predicting a "soft landing" for the economy. How does your view on the economy influence your cyclical analysis of assets like Bitcoin or gold?
Richard: The macroeconomic background has a significant impact on asset performance, especially during the current debt cycle and interest rate changes. Looking back at history, from 1955 to 1981, long-term interest rates experienced approximately 26 years of continuous growth, peaking at around 16%. According to the classic Kontradiev long-cycle theory, interest rates should have completed a cyclical bottom around 2007 and entered a new upward cycle. However, the 2008 subprime mortgage crisis led governments worldwide to implement massive stimulus policies, including zero interest rates and quantitative easing (QE), keeping interest rates low for over a decade. Only in recent years have interest rates begun to rise significantly, and we are currently in a phase of high debt levels and rising interest rates.
This combination presents significant challenges: heavy debt burdens and rising interest costs force fiscal policy to focus more on controlling volatility and interest rates. Asset performance is also profoundly affected; for example, Bitcoin has transformed into a completely different asset between 2012 and 2025, its deep integration into the liquidity system making it more susceptible to debt and policy cycles. Future asset trends require comprehensive analysis in conjunction with the macroeconomic context.
I'd like to mention stablecoins and money market funds again.
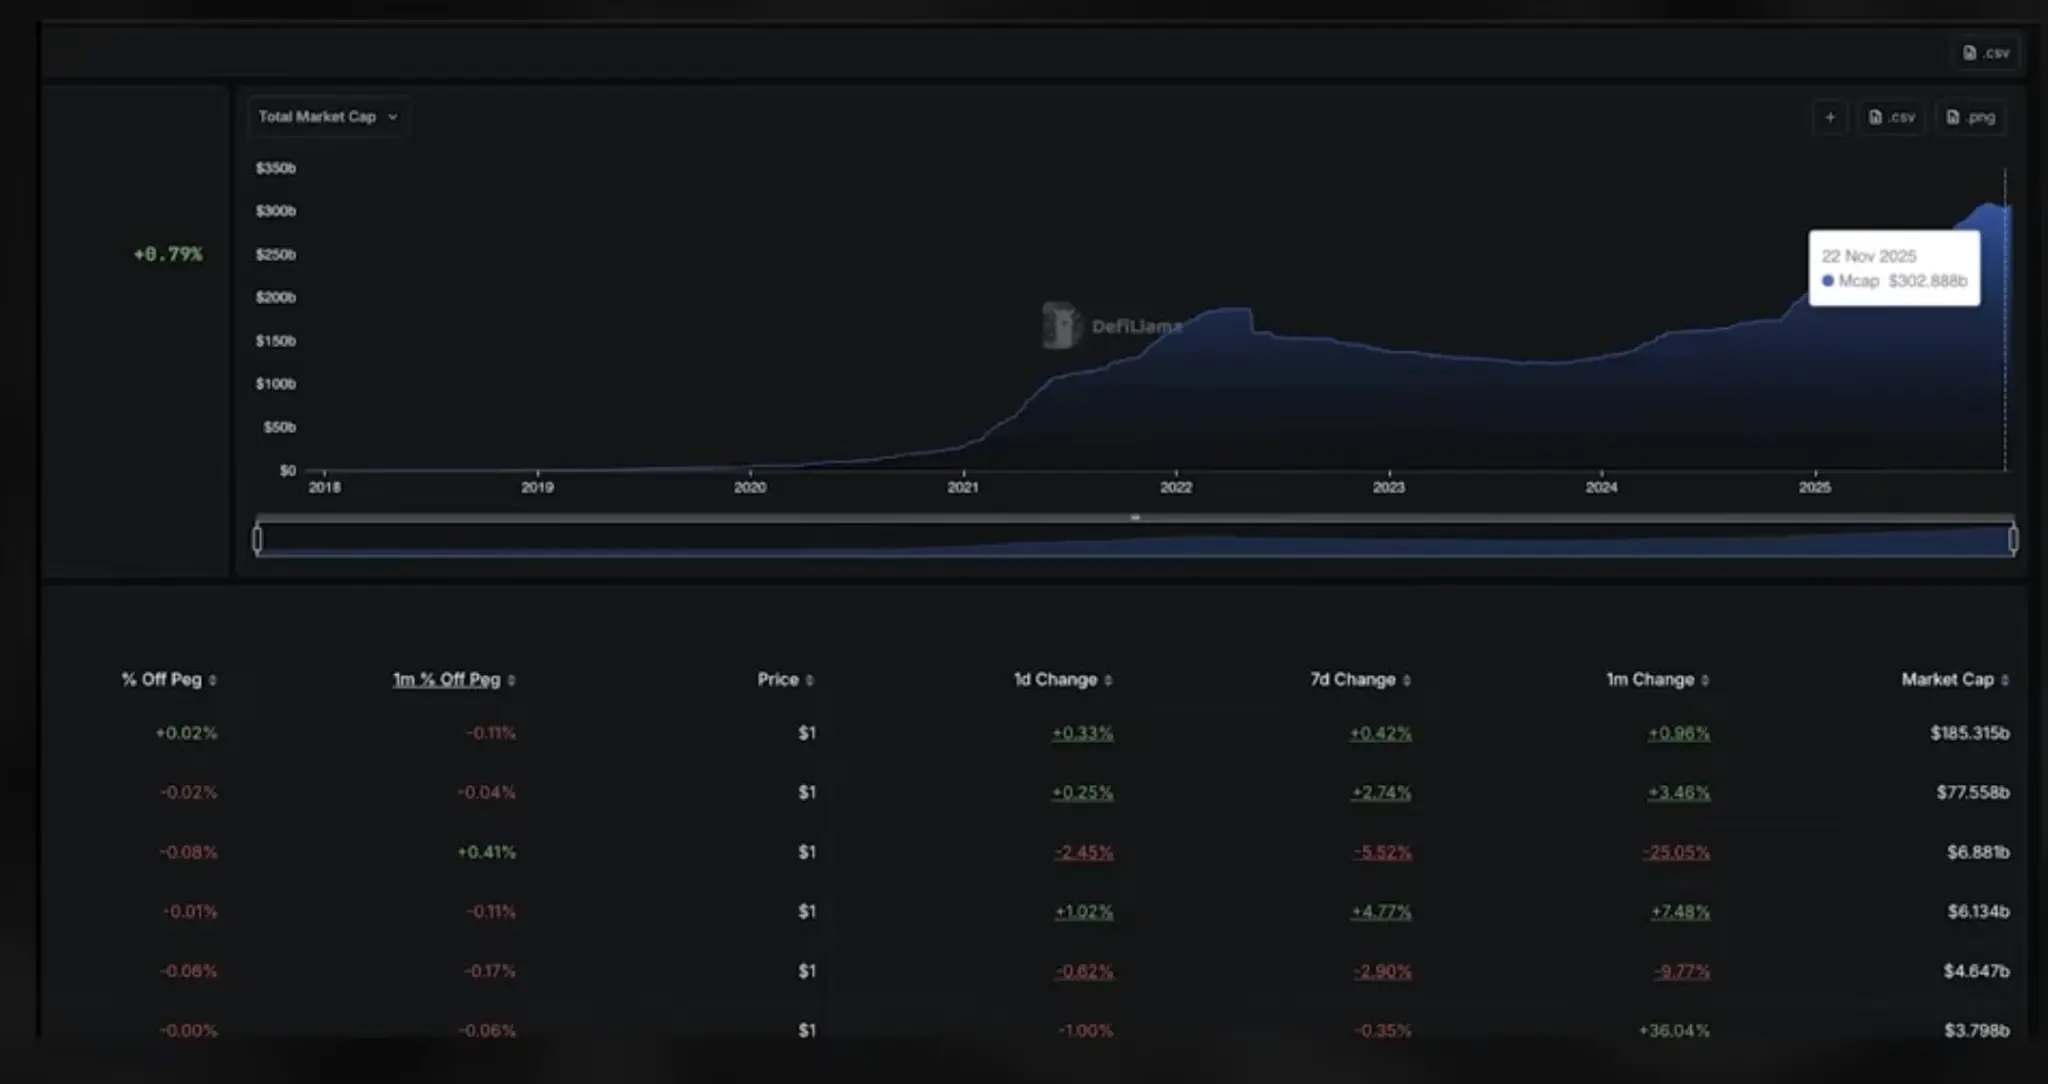
The market capitalization of stablecoins has grown steadily since 2018, from almost zero to over $300 billion. Particularly after Trump's election, the market capitalization of stablecoins experienced a sharp upward trend. Under the GENIUS Act, stablecoin issuers, after absorbing US dollars, must purchase short-term US Treasury bonds as reserves. This effectively provides a new avenue for foreigners to purchase US dollars and ultimately finance US Treasury bonds.
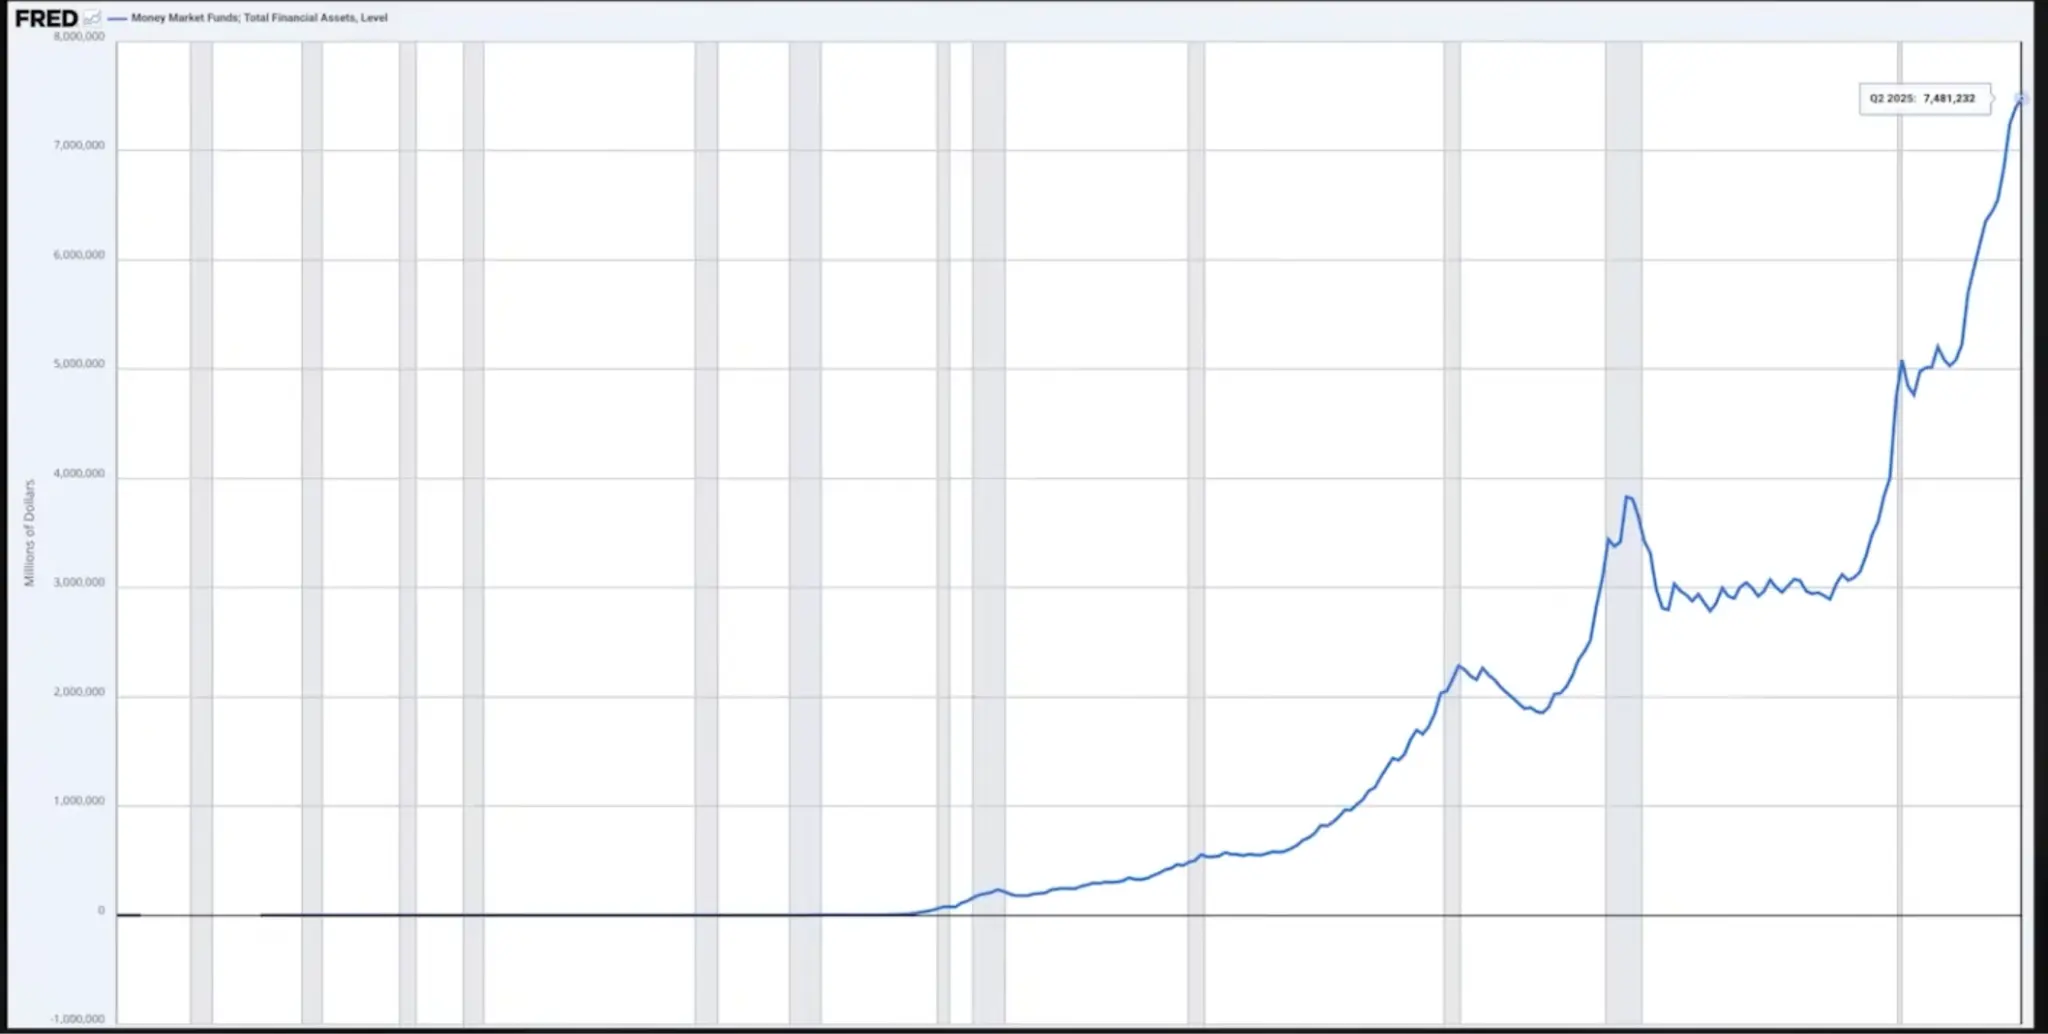
Similarly, the size of money market funds has also grown rapidly, reaching $7.5 trillion. These funds, after acquiring dollars, typically purchase short-term U.S. Treasury bonds, consistent with the pattern of stablecoins investing in short-term Treasury bonds after receiving funding. Both ultimately aim to achieve the same goal: assisting the U.S. Treasury in continuously refinancing its massive amounts of short-term Treasury bonds.
Currently, the U.S. Treasury prefers to issue short-term Treasury bonds, primarily because the interest rates on long-term bonds are too high, and large-scale issuance of long-term debt would lead to an excessive interest burden over the next few decades. To address the current political and economic realities, the Treasury prioritizes short-term funding needs, such as "holding out until the midterm elections," while temporarily setting aside long-term risks.
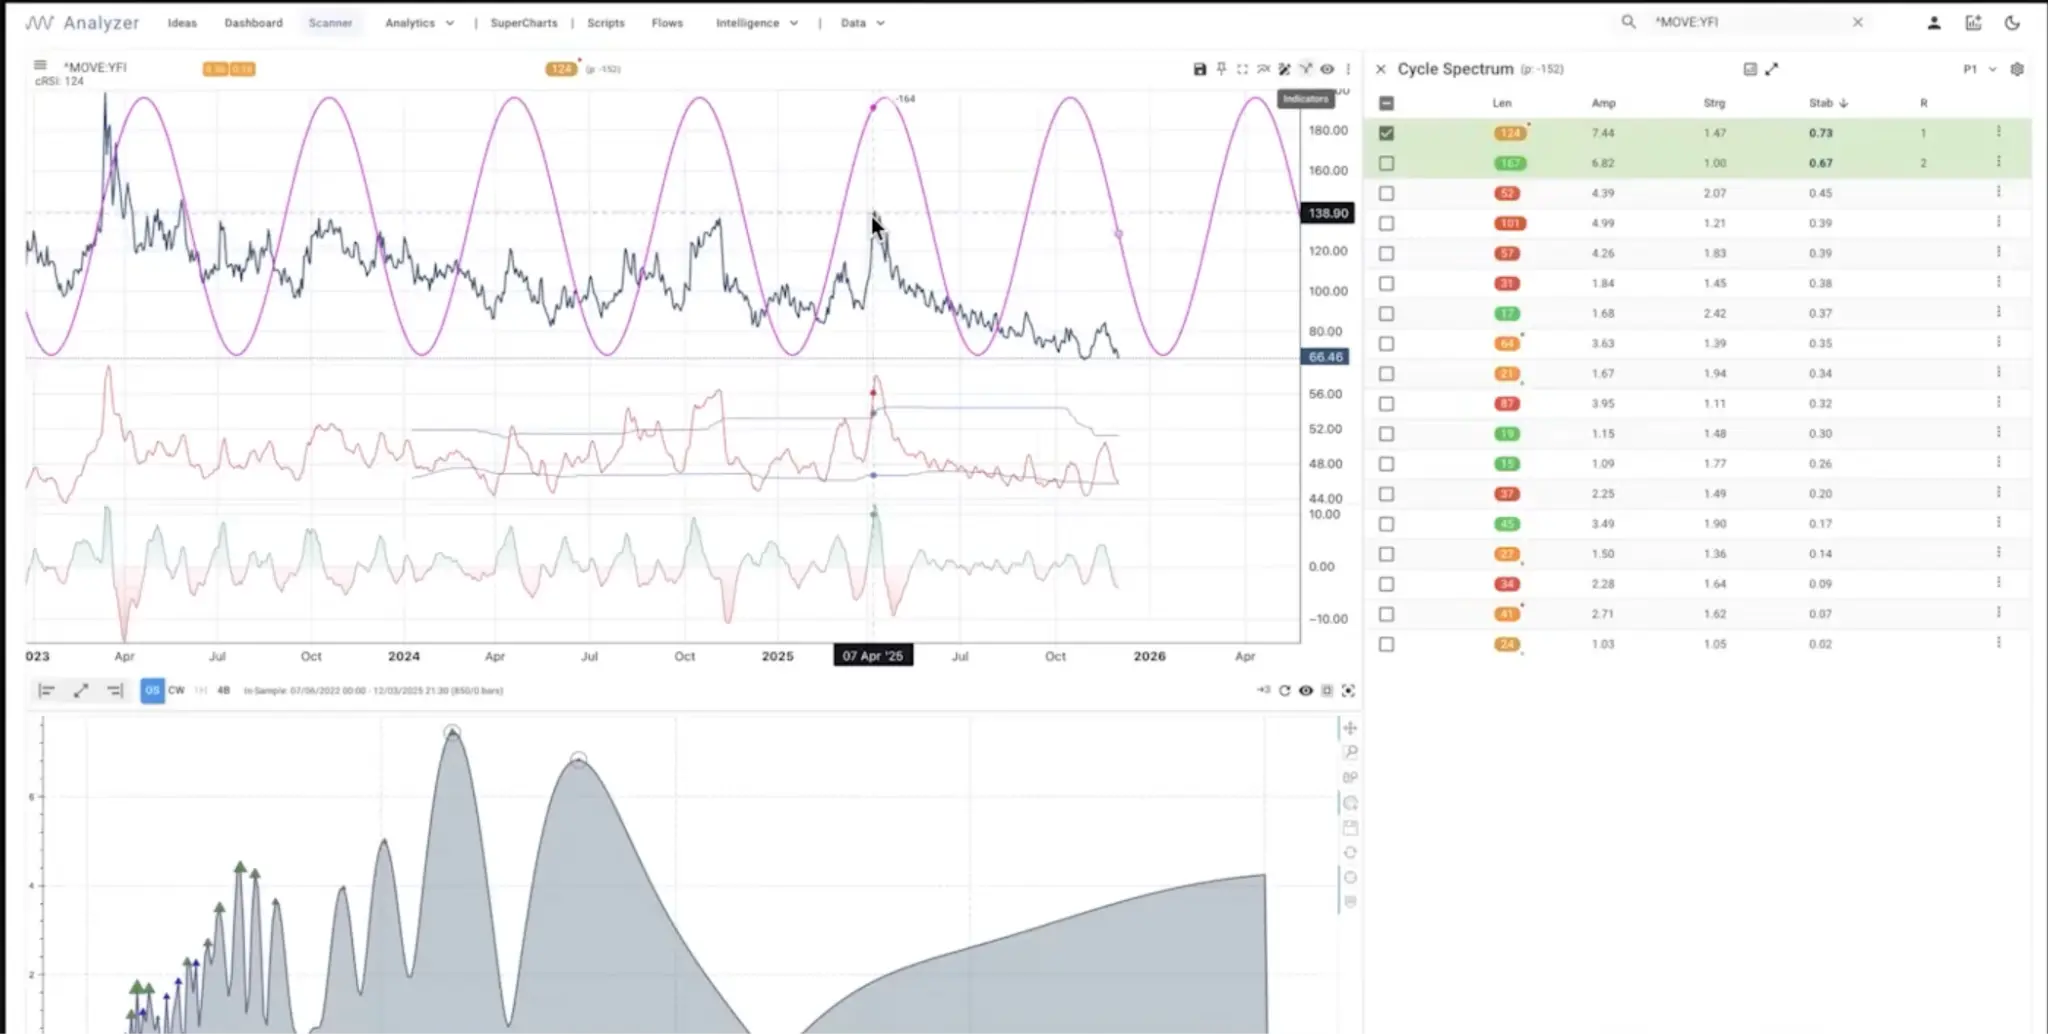
Richard: The MOVE index (also known as the "VIX of the bond market"), which measures implied volatility in the US Treasury market, remains low. It has fallen sharply since April and is currently at a historical low. This indicates that there is no crisis in the Treasury market at present. As long as the volatility of these assets is low, their value as collateral remains high, and the repurchase system can function normally. I don't see any signs of a major crisis in the Treasury market at the moment, and this situation is likely to continue at least until January. As long as the bond market remains liquid, even a slight easing by the Federal Reserve would be beneficial for the stock market and cryptocurrencies.
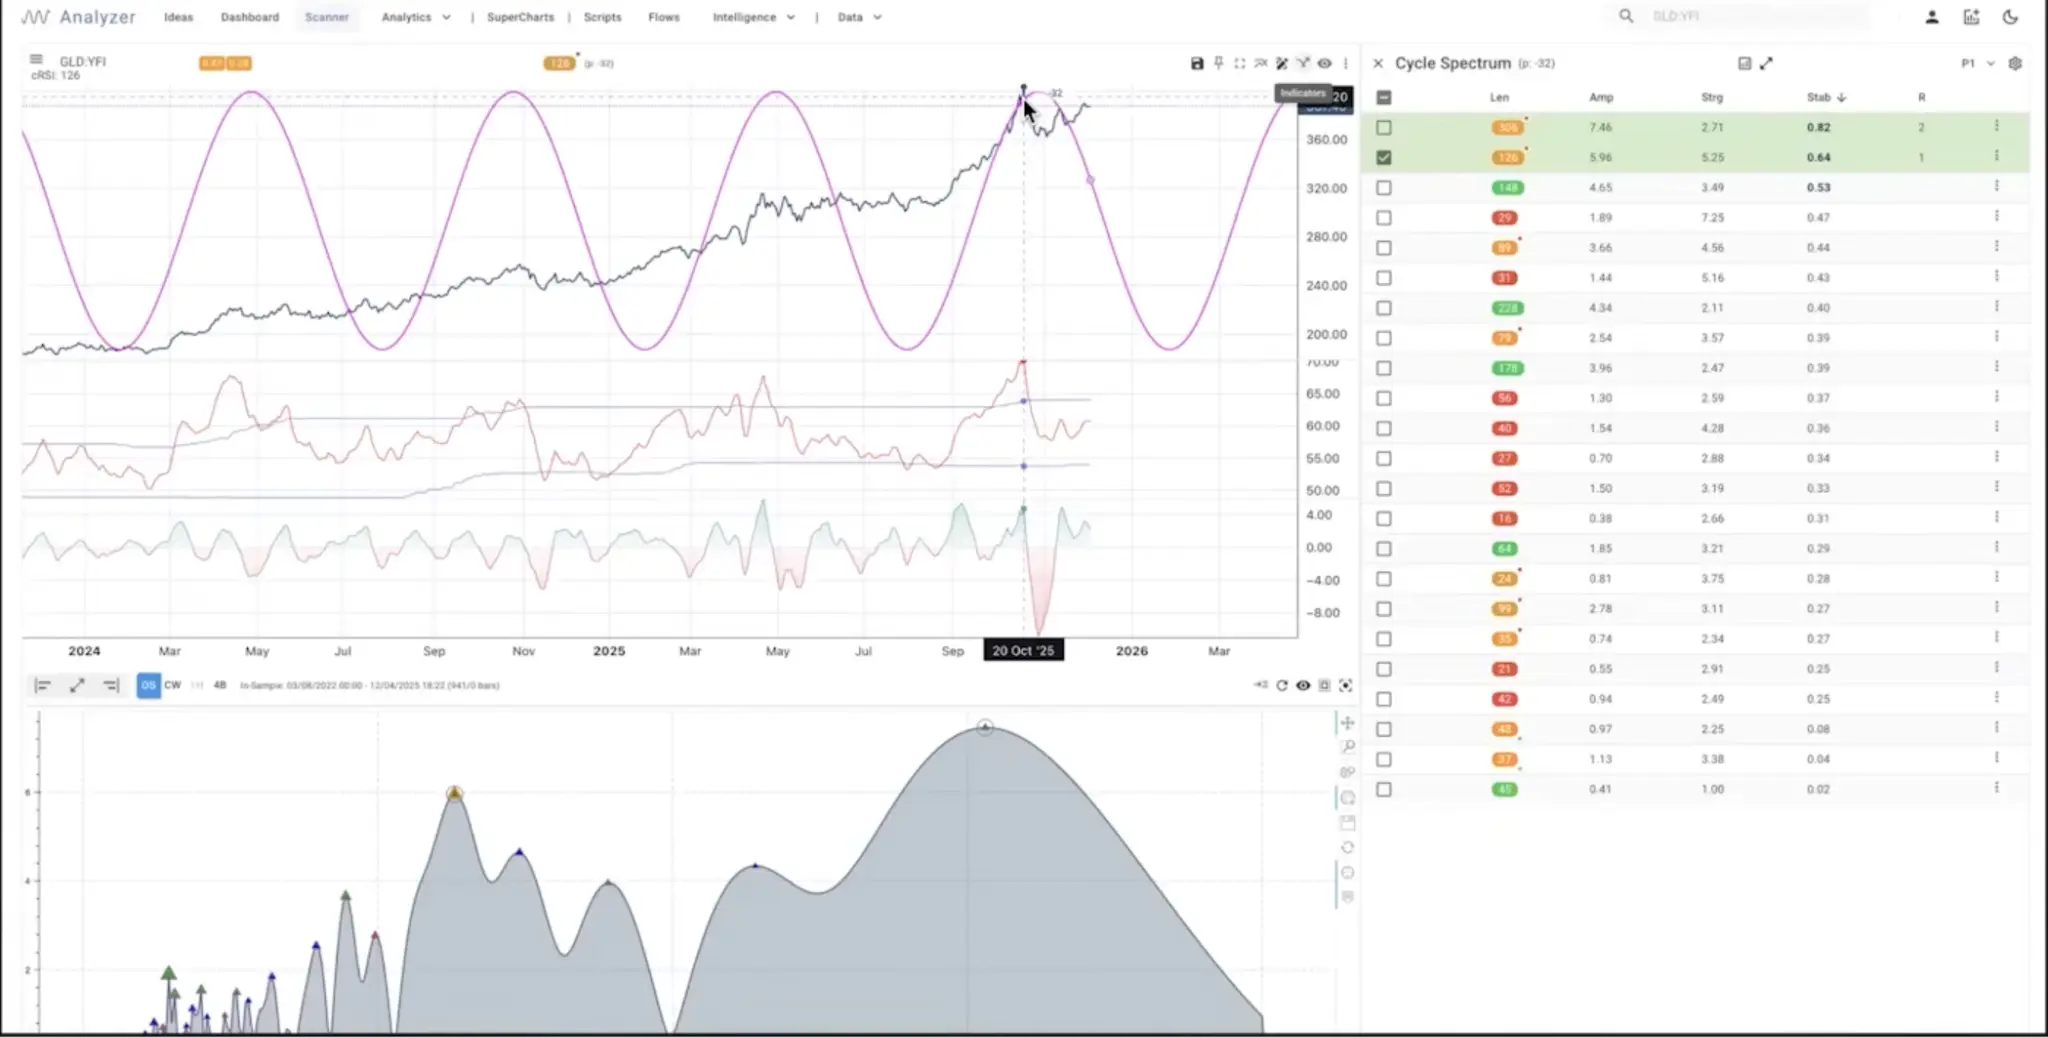
Now let's look at gold (GLD). Our cyclical analysis indicated that gold should have peaked, and it did indeed peak around October 20th. While there wasn't a crash, the cyclical forces did slow its upward momentum. I believe the US seizure of Russian assets during the Russia-Ukraine war was a serious warning to the global dollar system. This prompted central banks in some countries (especially the BRICS nations) to buy gold to reduce their complete dependence on the dollar and the US government. This was part of the reason driving up gold prices.
Host: How much of a correction do you think gold will experience? Historically, after the bull market peaks of 2011 and 1980, gold experienced significant declines of 40% to 60%.
Richard: The strength of cycle analysis lies in revealing "time" and "direction," but it cannot directly predict the magnitude of rises and falls. Although multiple cycle models point to gold peaking here, this does not mean it will "crash." Personally, I believe that gold will not experience a catastrophic decline due to real concerns about the US federal deficit and central bank gold purchases driven by geopolitical factors . It simply needs a "breathing room," and the cycle suggests that this breathing space may have arrived.
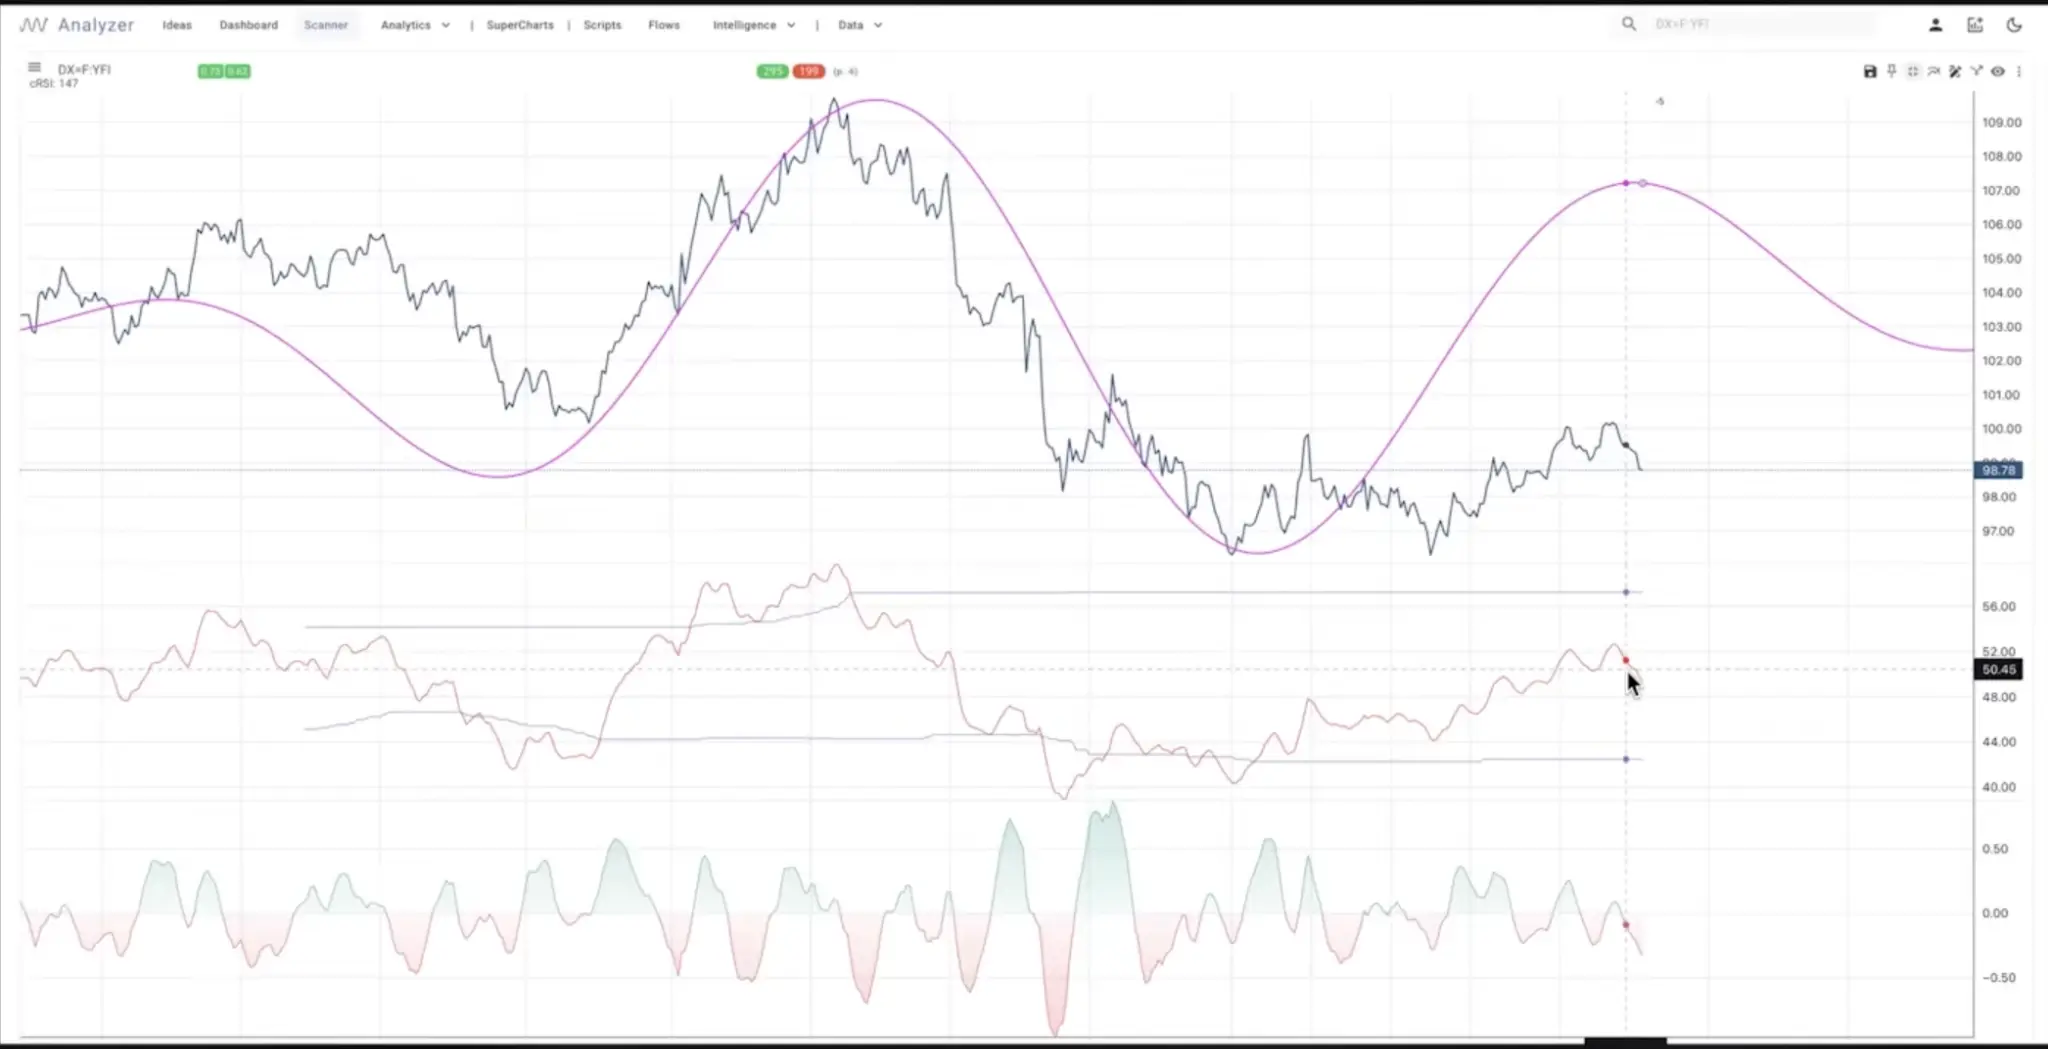
Closely related to gold is the fate of the US dollar. In my view, the dollar is forming a bottom. It may still have some downside, and could even hit a new low, but this is likely the final low. This is a proprietary momentum indicator we use called the "Cyclical RSI." You can see that the dollar's momentum is rising, but the price increase is not as rapid. I expect the dollar price to likely fall further, but the momentum will remain stable. I think we will see a significant rebound in the dollar by 2026. Of course, this will put pressure on dollar-denominated assets such as gold. Overall, I expect gold to trade sideways or decline over the next 6 to 12 months .
"The Bubble of Everything" and a Warning of a Crisis in 2026
Host: Do you think that the cycle of one asset (such as gold) can be used to predict the cycle of another related asset (such as the US dollar)?
Richard: Yes, you can often see similar cycle lengths across highly correlated assets. That's why I watch various markets, trying to grasp what I call the "fiscal-driven" macro picture. The primary task for the current market is managing Treasury bonds and the federal deficit.
I even have a seemingly crazy idea: the massive investments we're seeing in AI data centers are ultimately aimed at pushing down Treasury yields. When these tech giants finance their data centers with long-term debt, these newly issued, reasonably-yielding corporate bonds enter the debt system, providing a benchmark for Treasury bonds and thus helping to lower yields. Simultaneously, these companies need to participate more in the Treasury market to hedge loan risks. All of this is to keep interest rates low across the entire yield curve. I suspect that this massive investment in AI is motivated more by fiscally driven needs than by genuine productivity requirements.
Host: Speaking of which, I can't help but wonder, are we currently in an "Everything Bubble"? Since 2008, and especially after the 2020 pandemic, we've seen almost all assets—stocks, Bitcoin, gold, real estate—rise together, driven by the expansion of the money supply. Where do you think we are in this cycle?
Richard: You're right. The root of this "bubble" is the unprecedented low interest rates that have led to an astonishing expansion of financial assets. From 2008 to the present, this bull market has almost perfectly mirrored the trajectory of the 10-year Treasury yield falling from 16%-17% to zero.
While interest rates have now risen, the Federal Reserve has offset the negative impact of the rate hikes through massive stimulus measures (QE). However, without another sudden crisis, this massive stimulus can no longer be justified. We are in a very delicate situation: the country is near bankruptcy, and the currency is facing a crisis.
I think this situation can continue for a while longer, but not too long. My intuition tells me that the turning point will be around mid-2026.
Host: You mentioned that JP Morgan predicts a record $1.8 trillion in bond issuance in 2026, primarily driven by AI investments. If this really does depress yields, wouldn't that be good for risk assets? Doesn't this contradict your statement about a "top phase"?
Richard: This is a key reason why I believe the peak phase might be "extended" or "shifted to the right" (a cyclical analysis term referring to the peak occurring later than expected). The market still has "ammunition." For example, the Fed's interest rate is currently 3.75%, and people are used to zero interest rates, so they feel there's "room for further rate cuts." I personally believe there's no room for rate cuts, but I think they will eventually cut rates. And this will ultimately lead to a surge in inflation and trigger a larger crisis.
Host: If this bigger crisis really breaks out, what will it look like?
Richard: It looks like it will be: soaring interest rates, a heavier burden on the budget from the federal deficit, rising populism, and voter anger. Frankly, the day I'm truly optimistic about the future will be when we no longer pin our hopes on the federal government to save us.
Host: So, are there any specific indicators or "road signs" that can help us observe whether we are approaching the crisis scenario you described?
Richard: Of course. I focus on two key metrics:
- MOVE Index: This is a volatility index for the bond market. You need to be wary of it starting to rise. Currently, it has been declining steadily since April, so things are okay.
- High-yield bond option-adjusted spread: This is a measure of the spread of high-risk debt, and it is also at a historical low.
As long as the volatility of these debts remains low and manageable, they can be used as collateral for refinancing within the system. The problem is that when these indicators start to rise sharply, a crisis is imminent. It's worth noting that a large number of loans (with an average maturity of about 5.5 years) from the zero-interest-rate period of 2020 are now facing refinancing pressures. So far, they have successfully managed to control the situation. But if the situation begins to change significantly, we will see a much larger pullback in financial assets.
Host: One last question, are there any mainstream financial assets that are completely non-cyclical, to the point that your analytical methods are not applicable?
Richard: I personally have had the least success in the natural gas market. Natural gas is an extremely difficult commodity to store, resulting in significant volatility, unlike other commodities such as oil which follow typical supply and demand cycles. Therefore, there are indeed some markets where cyclical analysis is difficult to apply. Furthermore, cyclical analysis is more effective in a long-term framework than in a short-term one (such as intraday trading).

