Author: OKX Research Institute
From 2015 to 2025, global financial markets experienced a dramatic cycle. From quantitative easing in the post-financial crisis era to the historic zero interest rate environment, and then to the sharp tightening cycle triggered by high inflation, the tide of macroeconomic fluctuations continuously impacted all asset classes. Against this backdrop, crypto assets, represented by BTC and ETH, far surpassed the gains of benchmarks, gold, and US Treasuries, completing a remarkable leap from geeky experiments to a fixture on the balance sheets of Wall Street institutions. However, these outperformance came with extreme risks: crypto assets experienced drawdowns exceeding 75% at one point, with recovery periods often stretching into years, while traditional assets demonstrated greater resilience.
To this end, the OKX Research Institute, focusing on the "10-year performance of the five major mainstream assets," attempts to answer a key question: Over a 10-year timescale, juxtaposing BTC and ETH with mainstream assets like gold, the S&P 500, and US Treasuries, what is the true picture of their respective returns and risks? Are we paying a corresponding, or even excessive, risk for the astonishing returns of crypto assets? To this end, we will go beyond a single yield comparison and strive to paint a complete, objective, and cross-cycle picture of asset performance. (Statistics as of August 31, 2025)
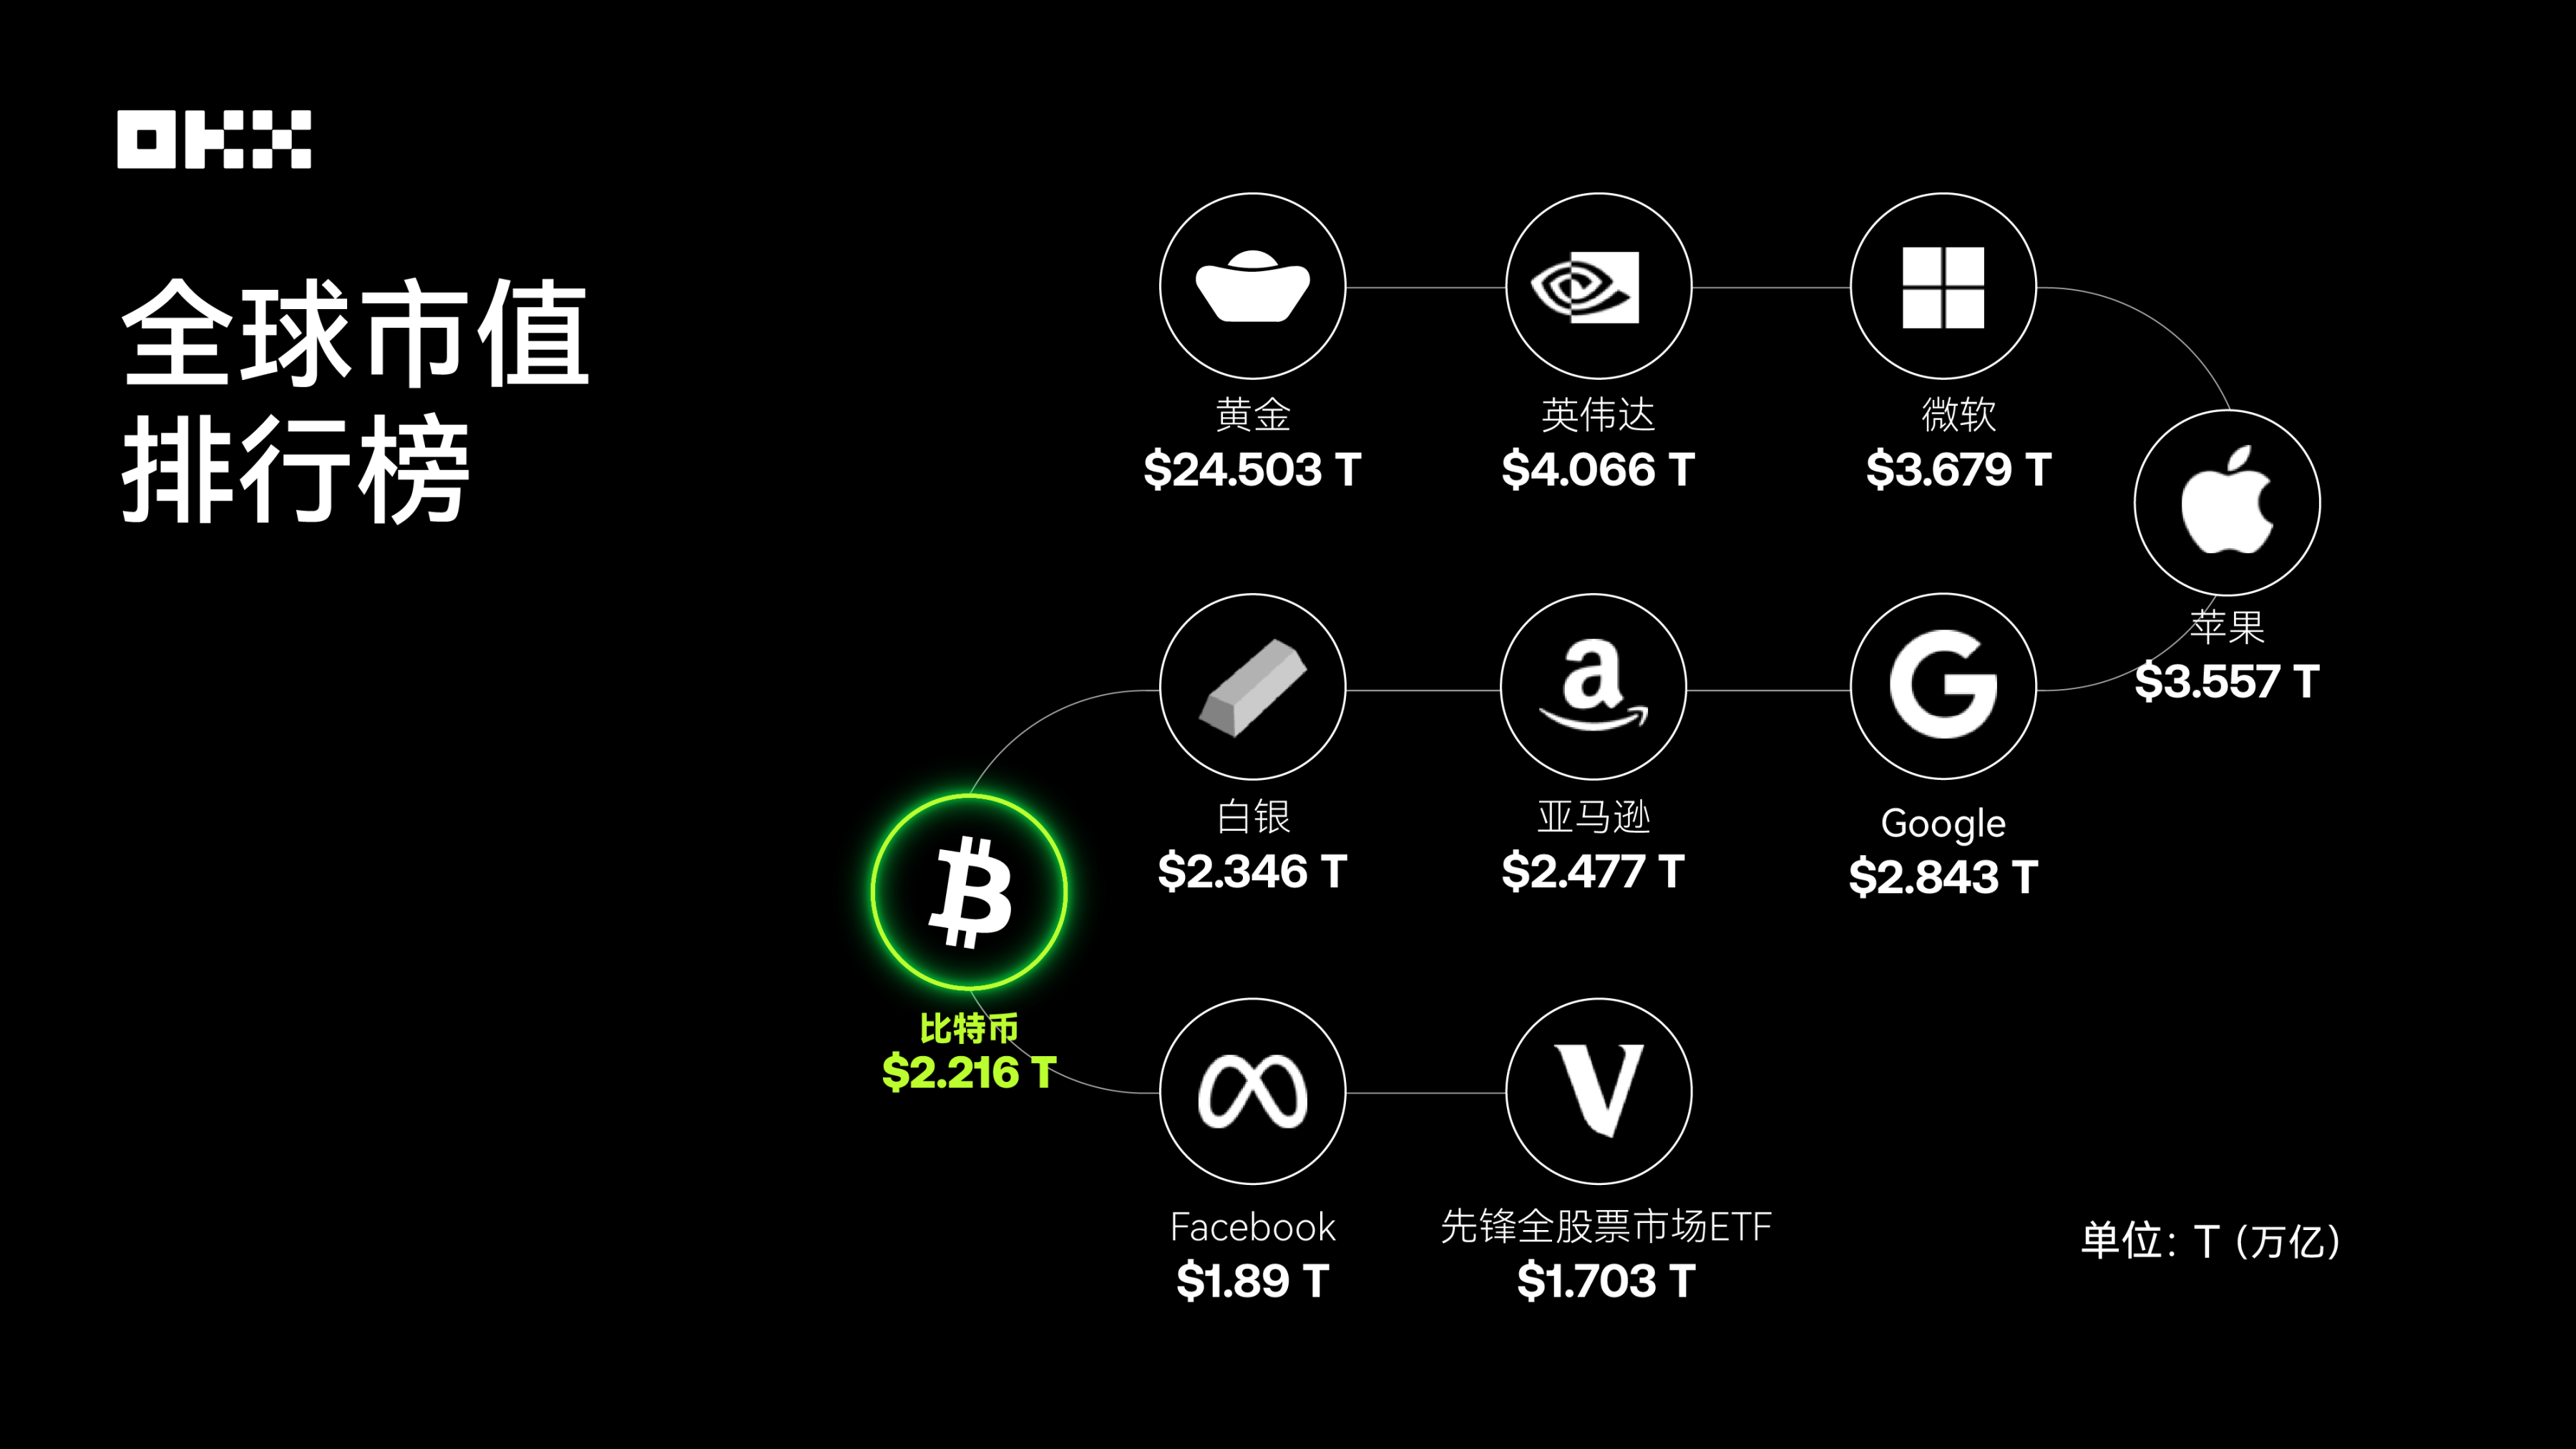
Data source: 8MarketCap; As of the end of August 2025, Bitcoin has ranked among the top in the world's major asset market capitalization rankings.
In the competition of returns, who is the king of assets?
The most intuitive way to evaluate an asset is to observe its long-term value growth trajectory. Let's assume we invested $10,000 in these five assets on August 1, 2015, and tracked their cumulative value changes through August 1, 2025. This comparison clearly reveals the vast differences in the wealth-creating abilities of different asset classes.
(I) Annual Price Snapshot: Value Scale at Key Nodes (2015-2025, August 1st of each year)
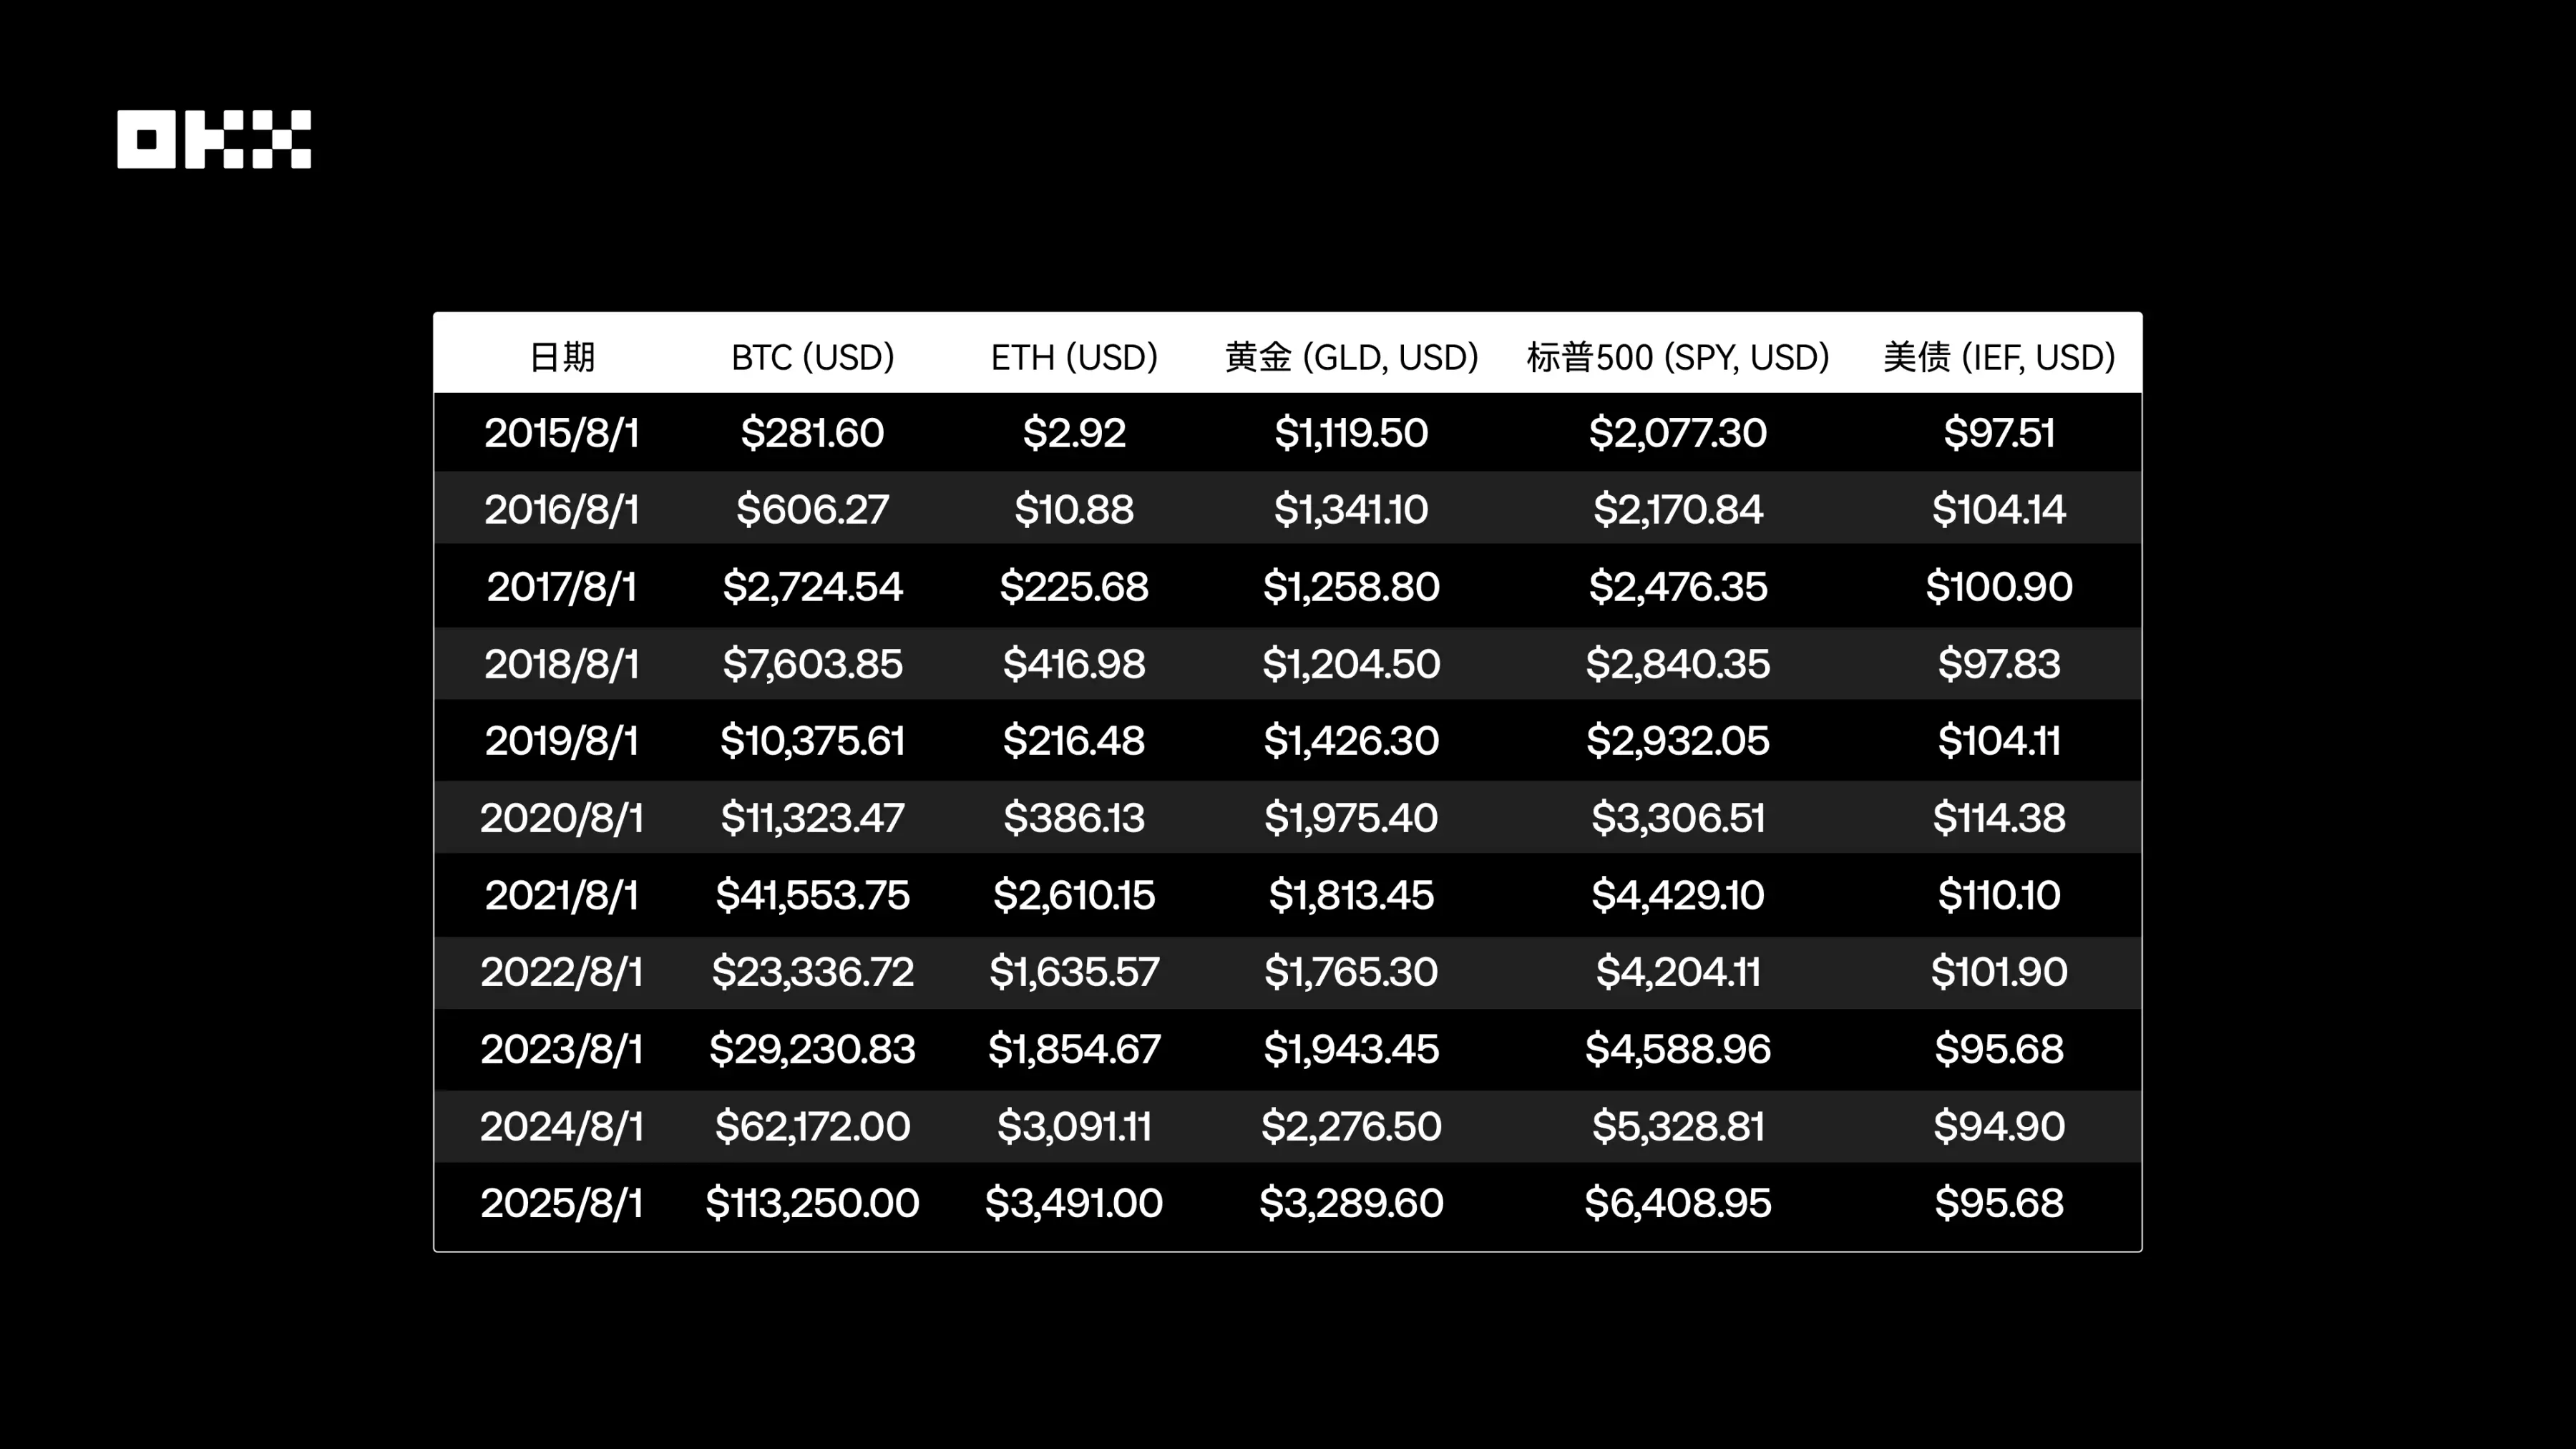
The following table records the closing prices of five core assets on August 1 (or the first trading day thereafter) every year from 2015 to 2025.
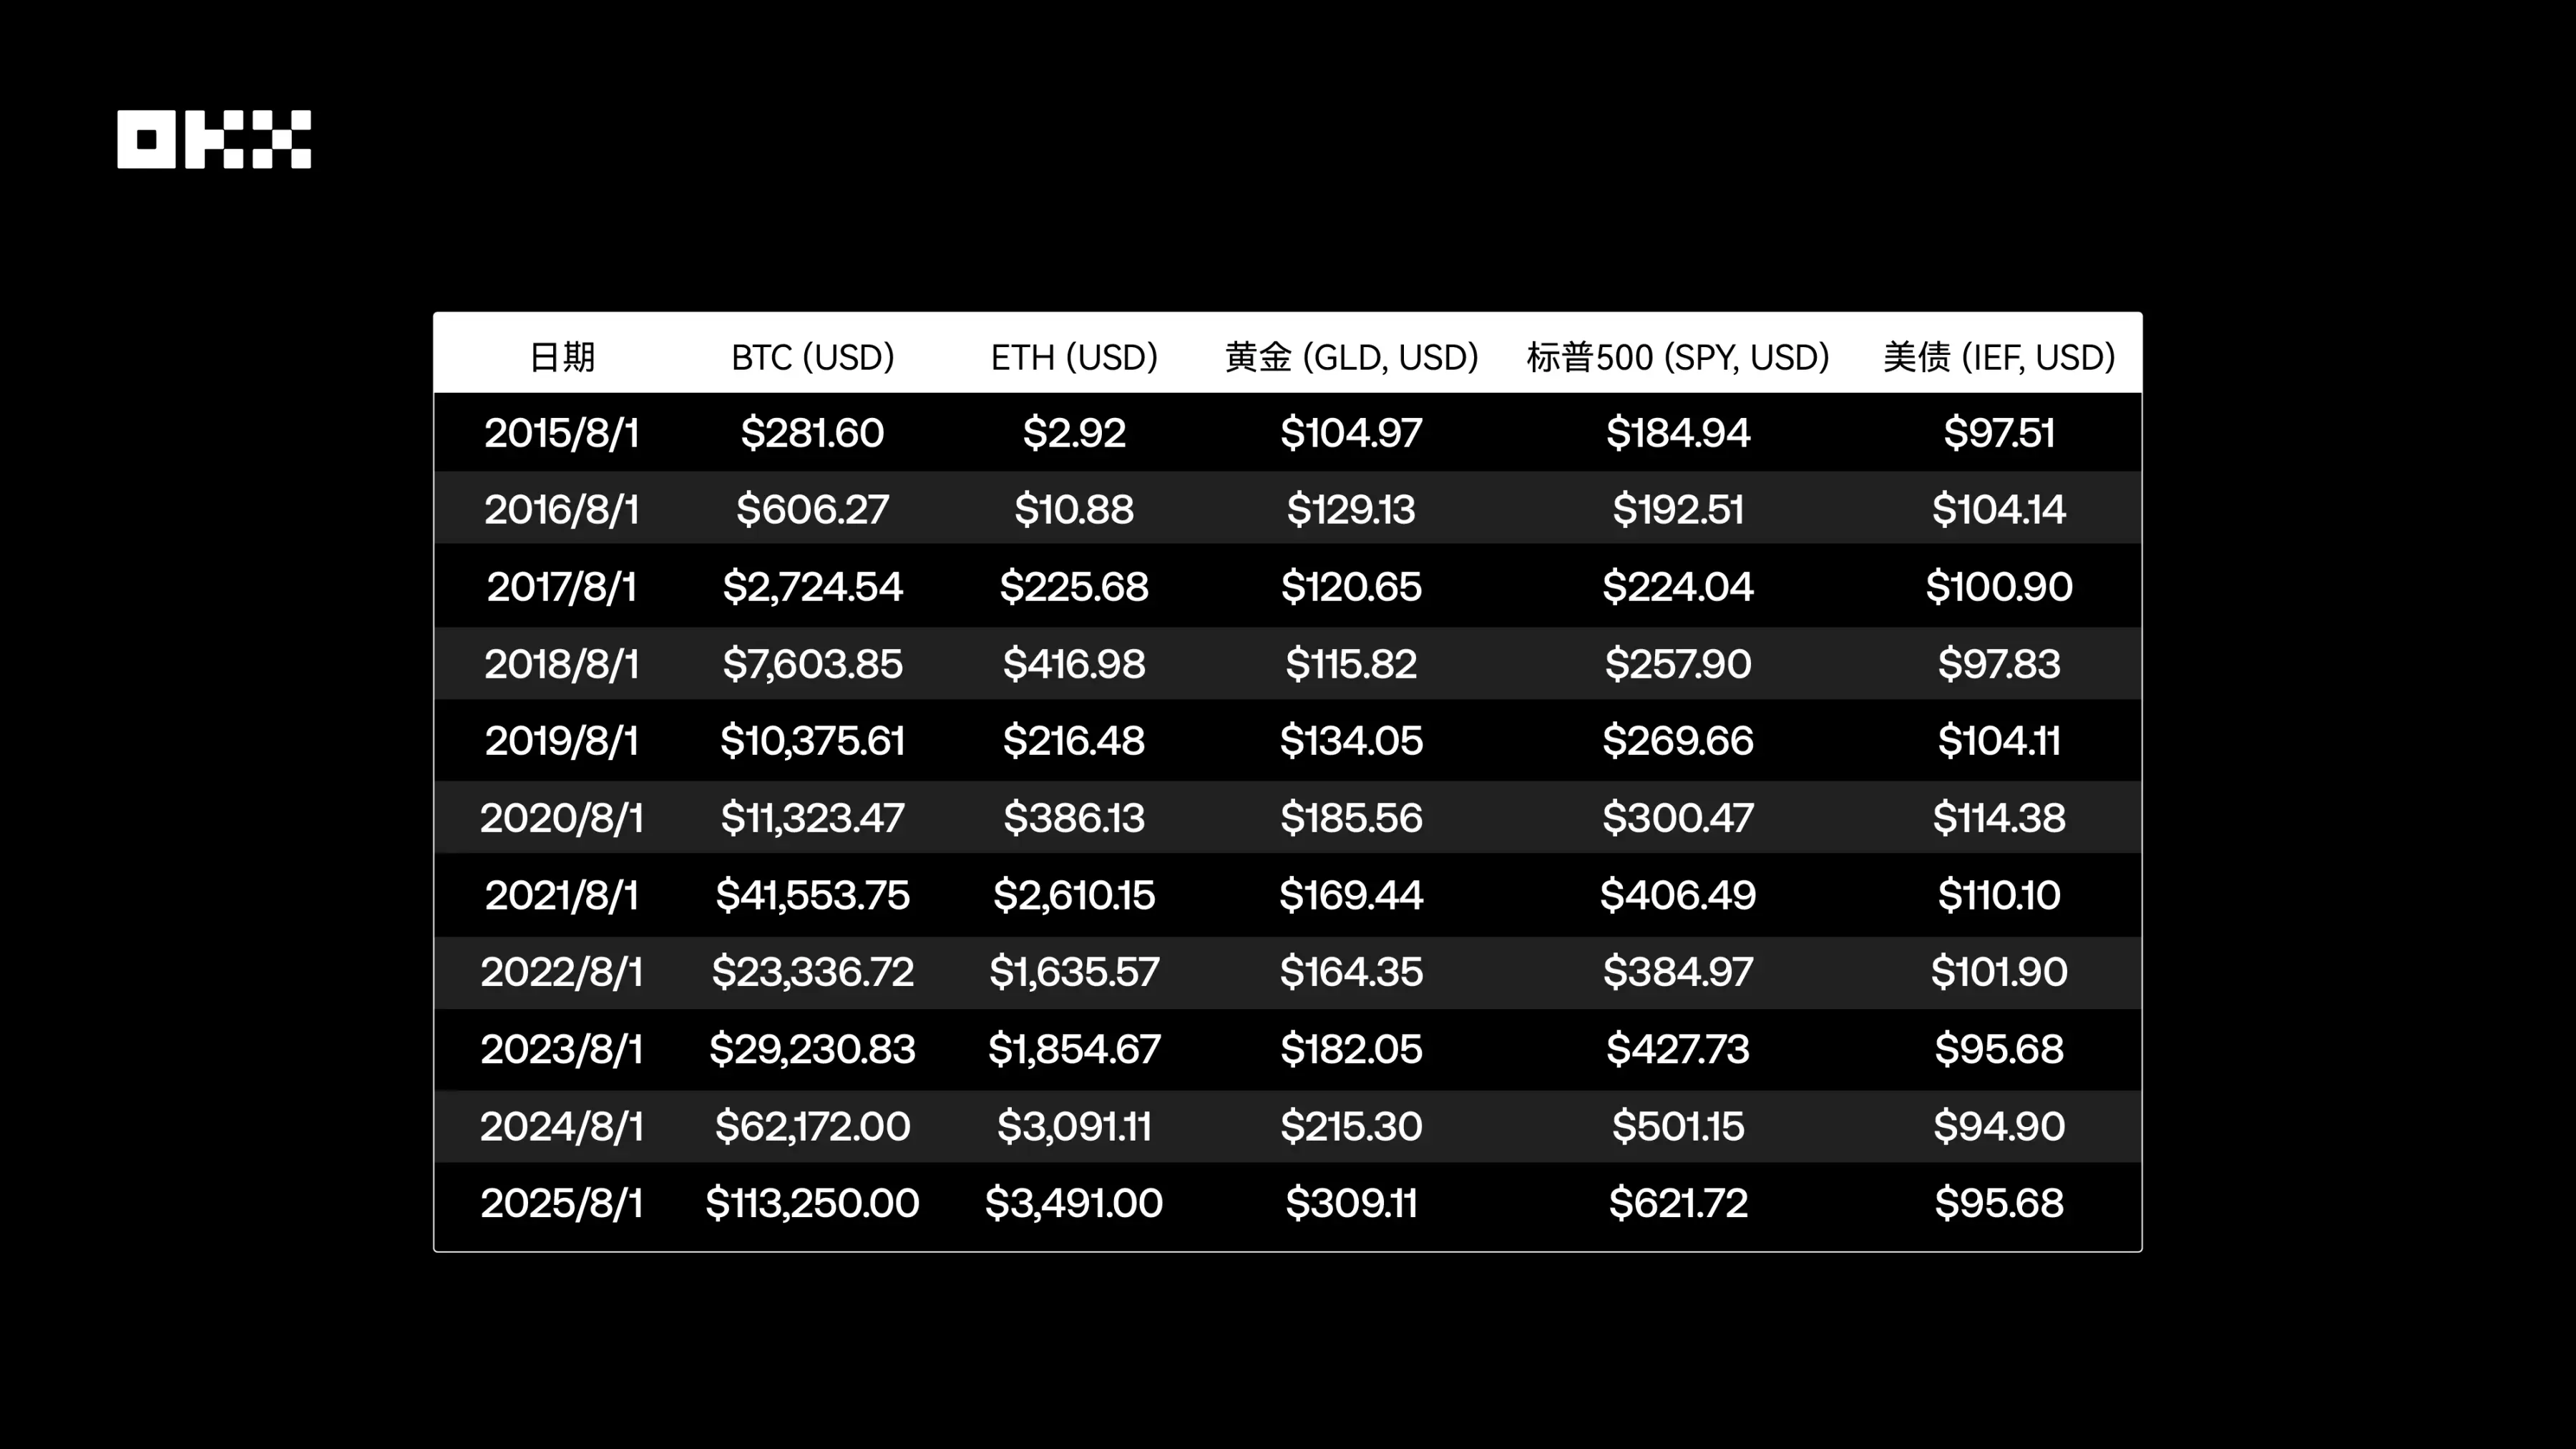
Data source: Based on Yahoo Finance and CoinGecko, the closing price is the closing price on the day or the first trading day thereafter. ETF prices are adjusted closing prices.
The price snapshot clearly shows that Bitcoin and Ethereum have experienced exponential growth, with their price magnitudes fundamentally shifting over the past decade. In contrast, the S&P 500 has demonstrated a robust bull market upward trajectory, while gold has exhibited fluctuations tied to macroeconomic cycles. U.S. Treasury prices have clearly reflected the changing interest rate environment, coming under significant pressure during the 2022-2023 rate hike cycle.
2. Peak Moments of the Year: Capturing the Highest Point of Each Cycle
Simply observing a price snapshot on a specific date is far from enough to paint a complete picture of an asset. Year-to-date price fluctuations, particularly peaks, reveal the asset's potential for explosive growth and the fear of missing out (FOMO) traders may face. The following table summarizes the highest prices reached by each asset during each annual cycle (from August 1st of the current year to July 31st of the following year).
Data source: Ethereum was launched on July 30, 2015. Early data had low liquidity and may contain certain errors. The remaining data is calculated based on Yahoo Finance daily historical data.
By observing the peak prices of each year, we can clearly see the magnitude of the asset growth. Bitcoin and Ethereum experienced dramatic price jumps during their bull markets. In contrast, the gaps between the annual highs and snapshot prices for the S&P 500 and gold were much smaller, reflecting their more mature and stable market characteristics.
(III) Wealth Growth Simulation: A 10-Year Fantasy Journey with $10,000
To more intuitively understand the wealth-creating power of different asset classes, we simulated a simple experiment: On August 1, 2015, $10,000 was invested in five different assets and held until August 1, 2025. The chart below displays the cumulative change in the value of this investment using a logarithmic scale. This scale better handles data with widely varying orders of magnitude, preventing the steep curve for high-growth assets from obscuring the details of other assets.
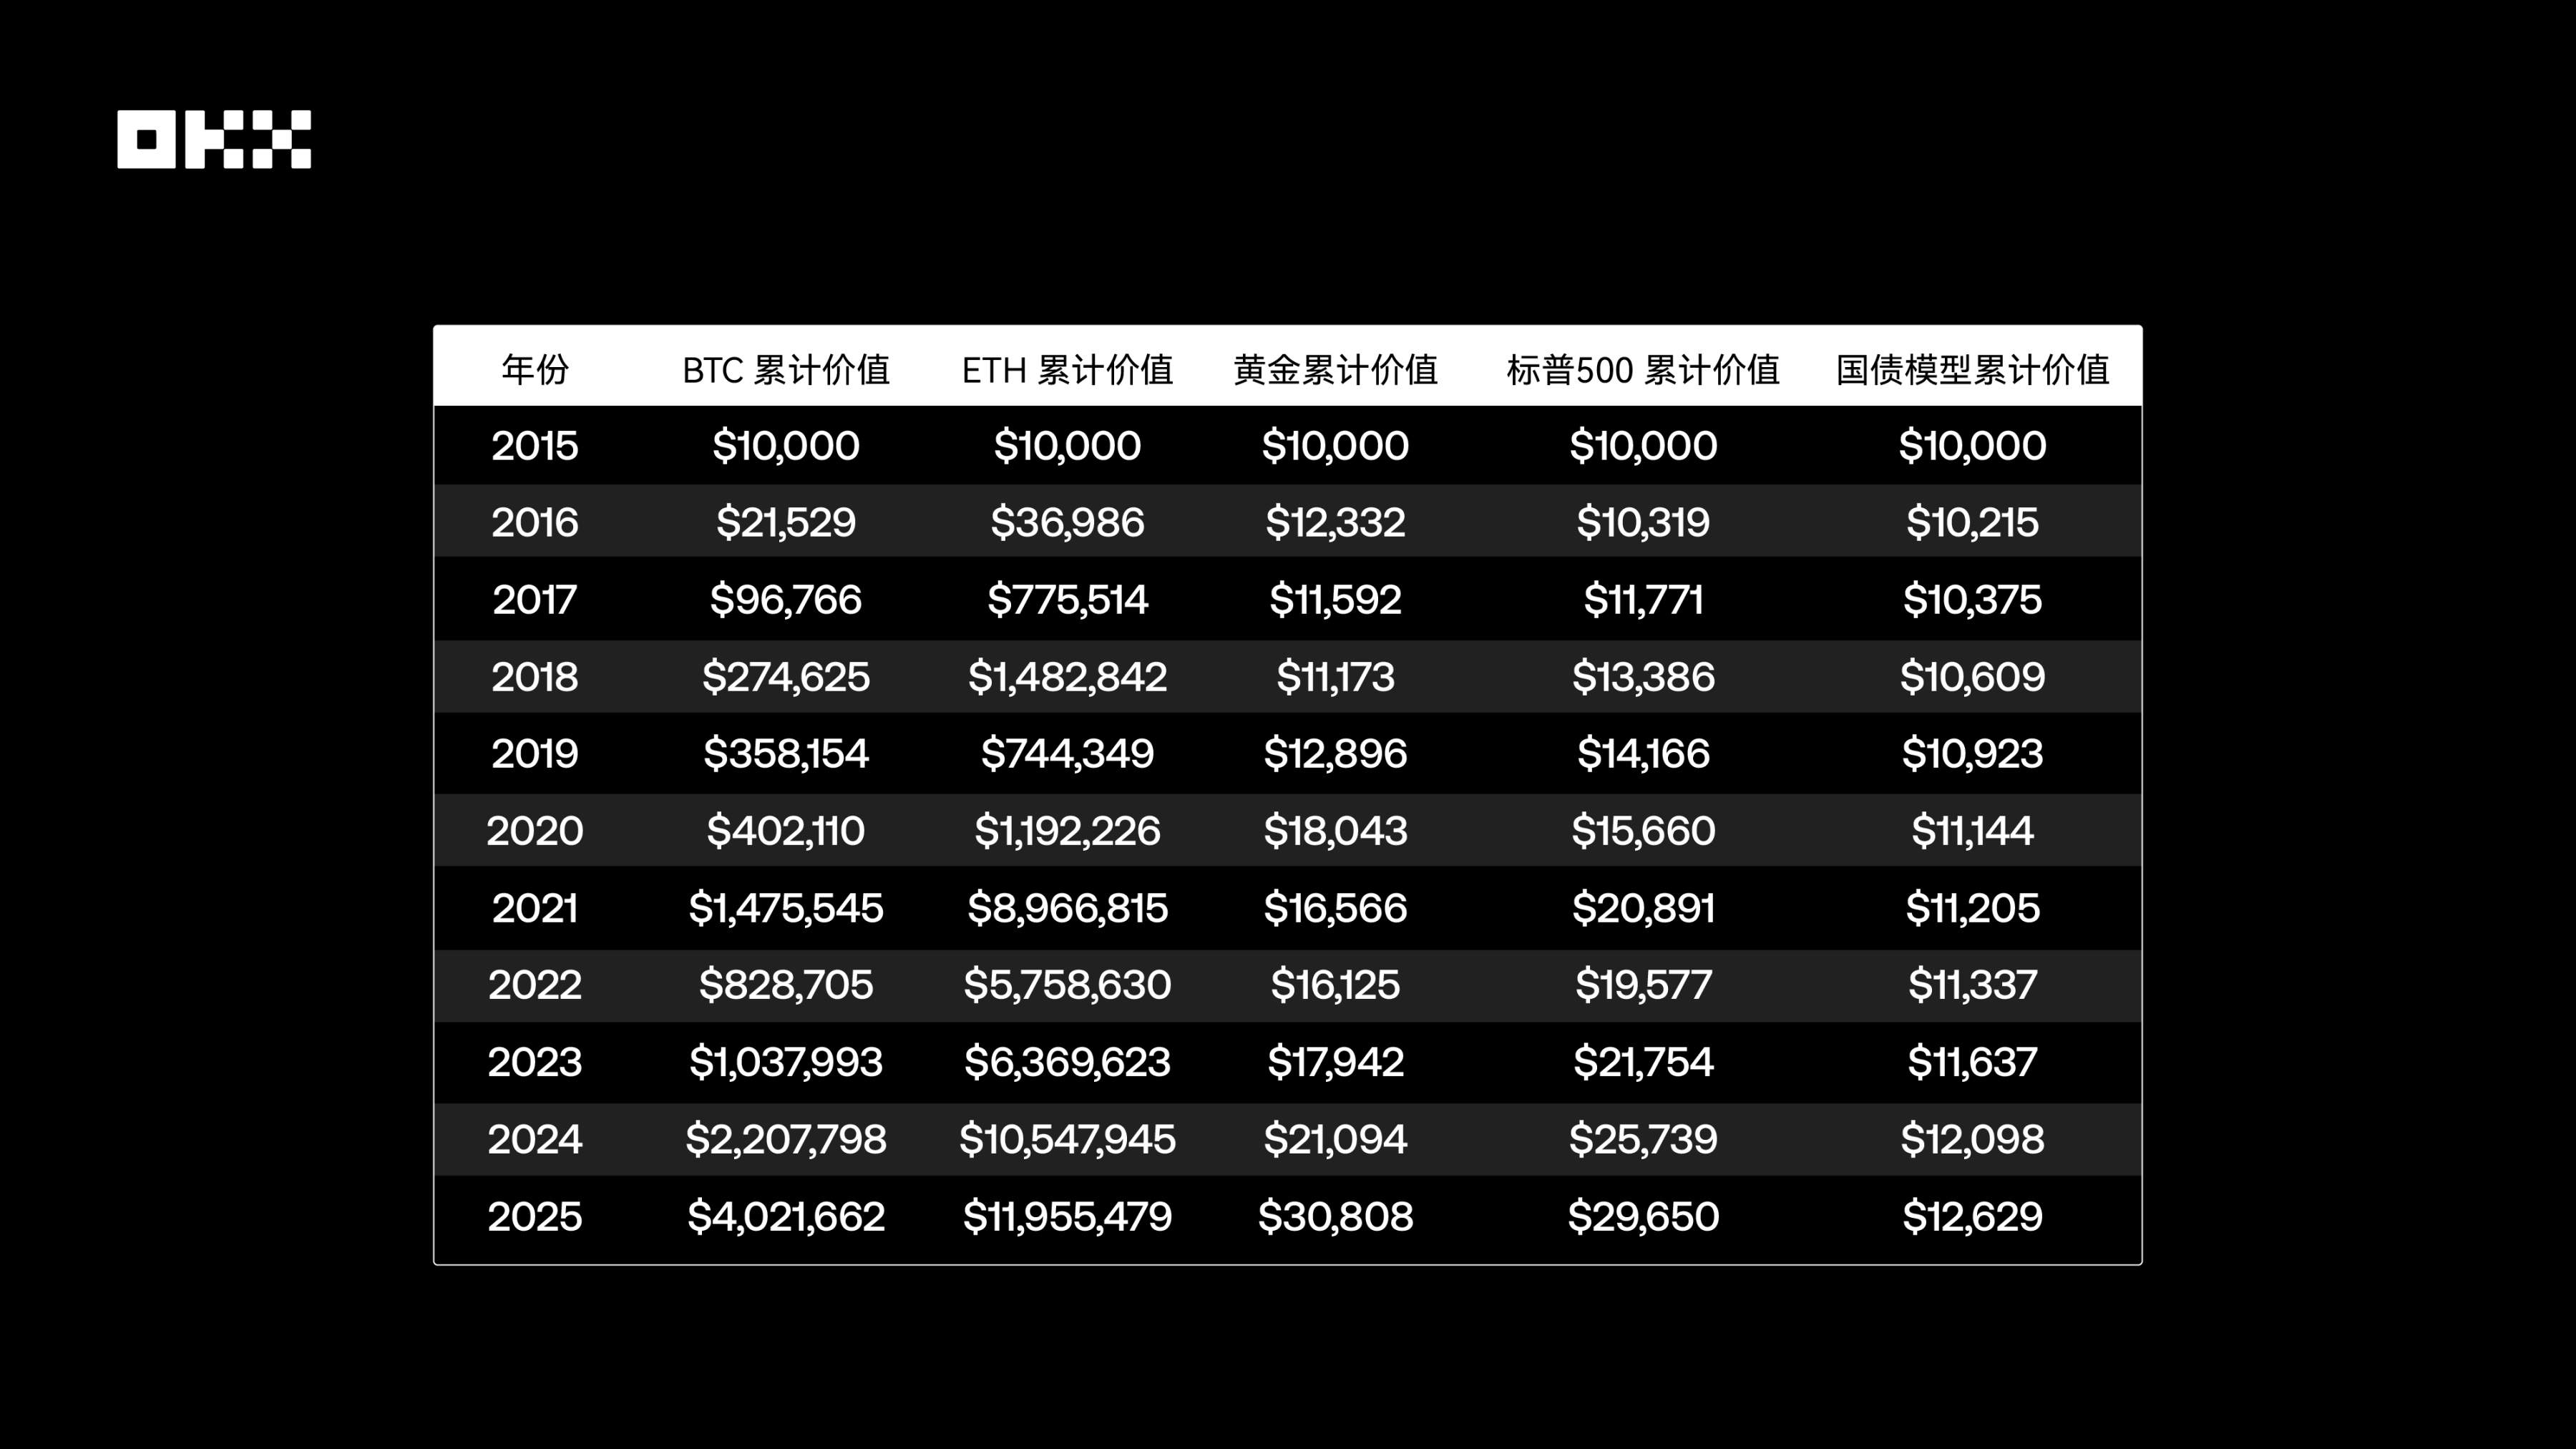
Data sources: Yahoo Finance, FRED, Macrotrends, etc.
The table shows that in the ten years from 2015 to 2025, the growth multiples of different assets are: BTC 402.17 times, with a cumulative return of approximately US$4.02 million in 10 years; ETH 1195.55 times, with a cumulative return of approximately US$11.95 million in 10 years; gold 3.08 times, with a cumulative return of approximately US$30,000 in 10 years; S&P 500 2.97 times, with a cumulative return of approximately US$29,600 in 10 years; and US Treasury bonds 1.26 times, with a cumulative return of only approximately US$12,600 in 10 years.
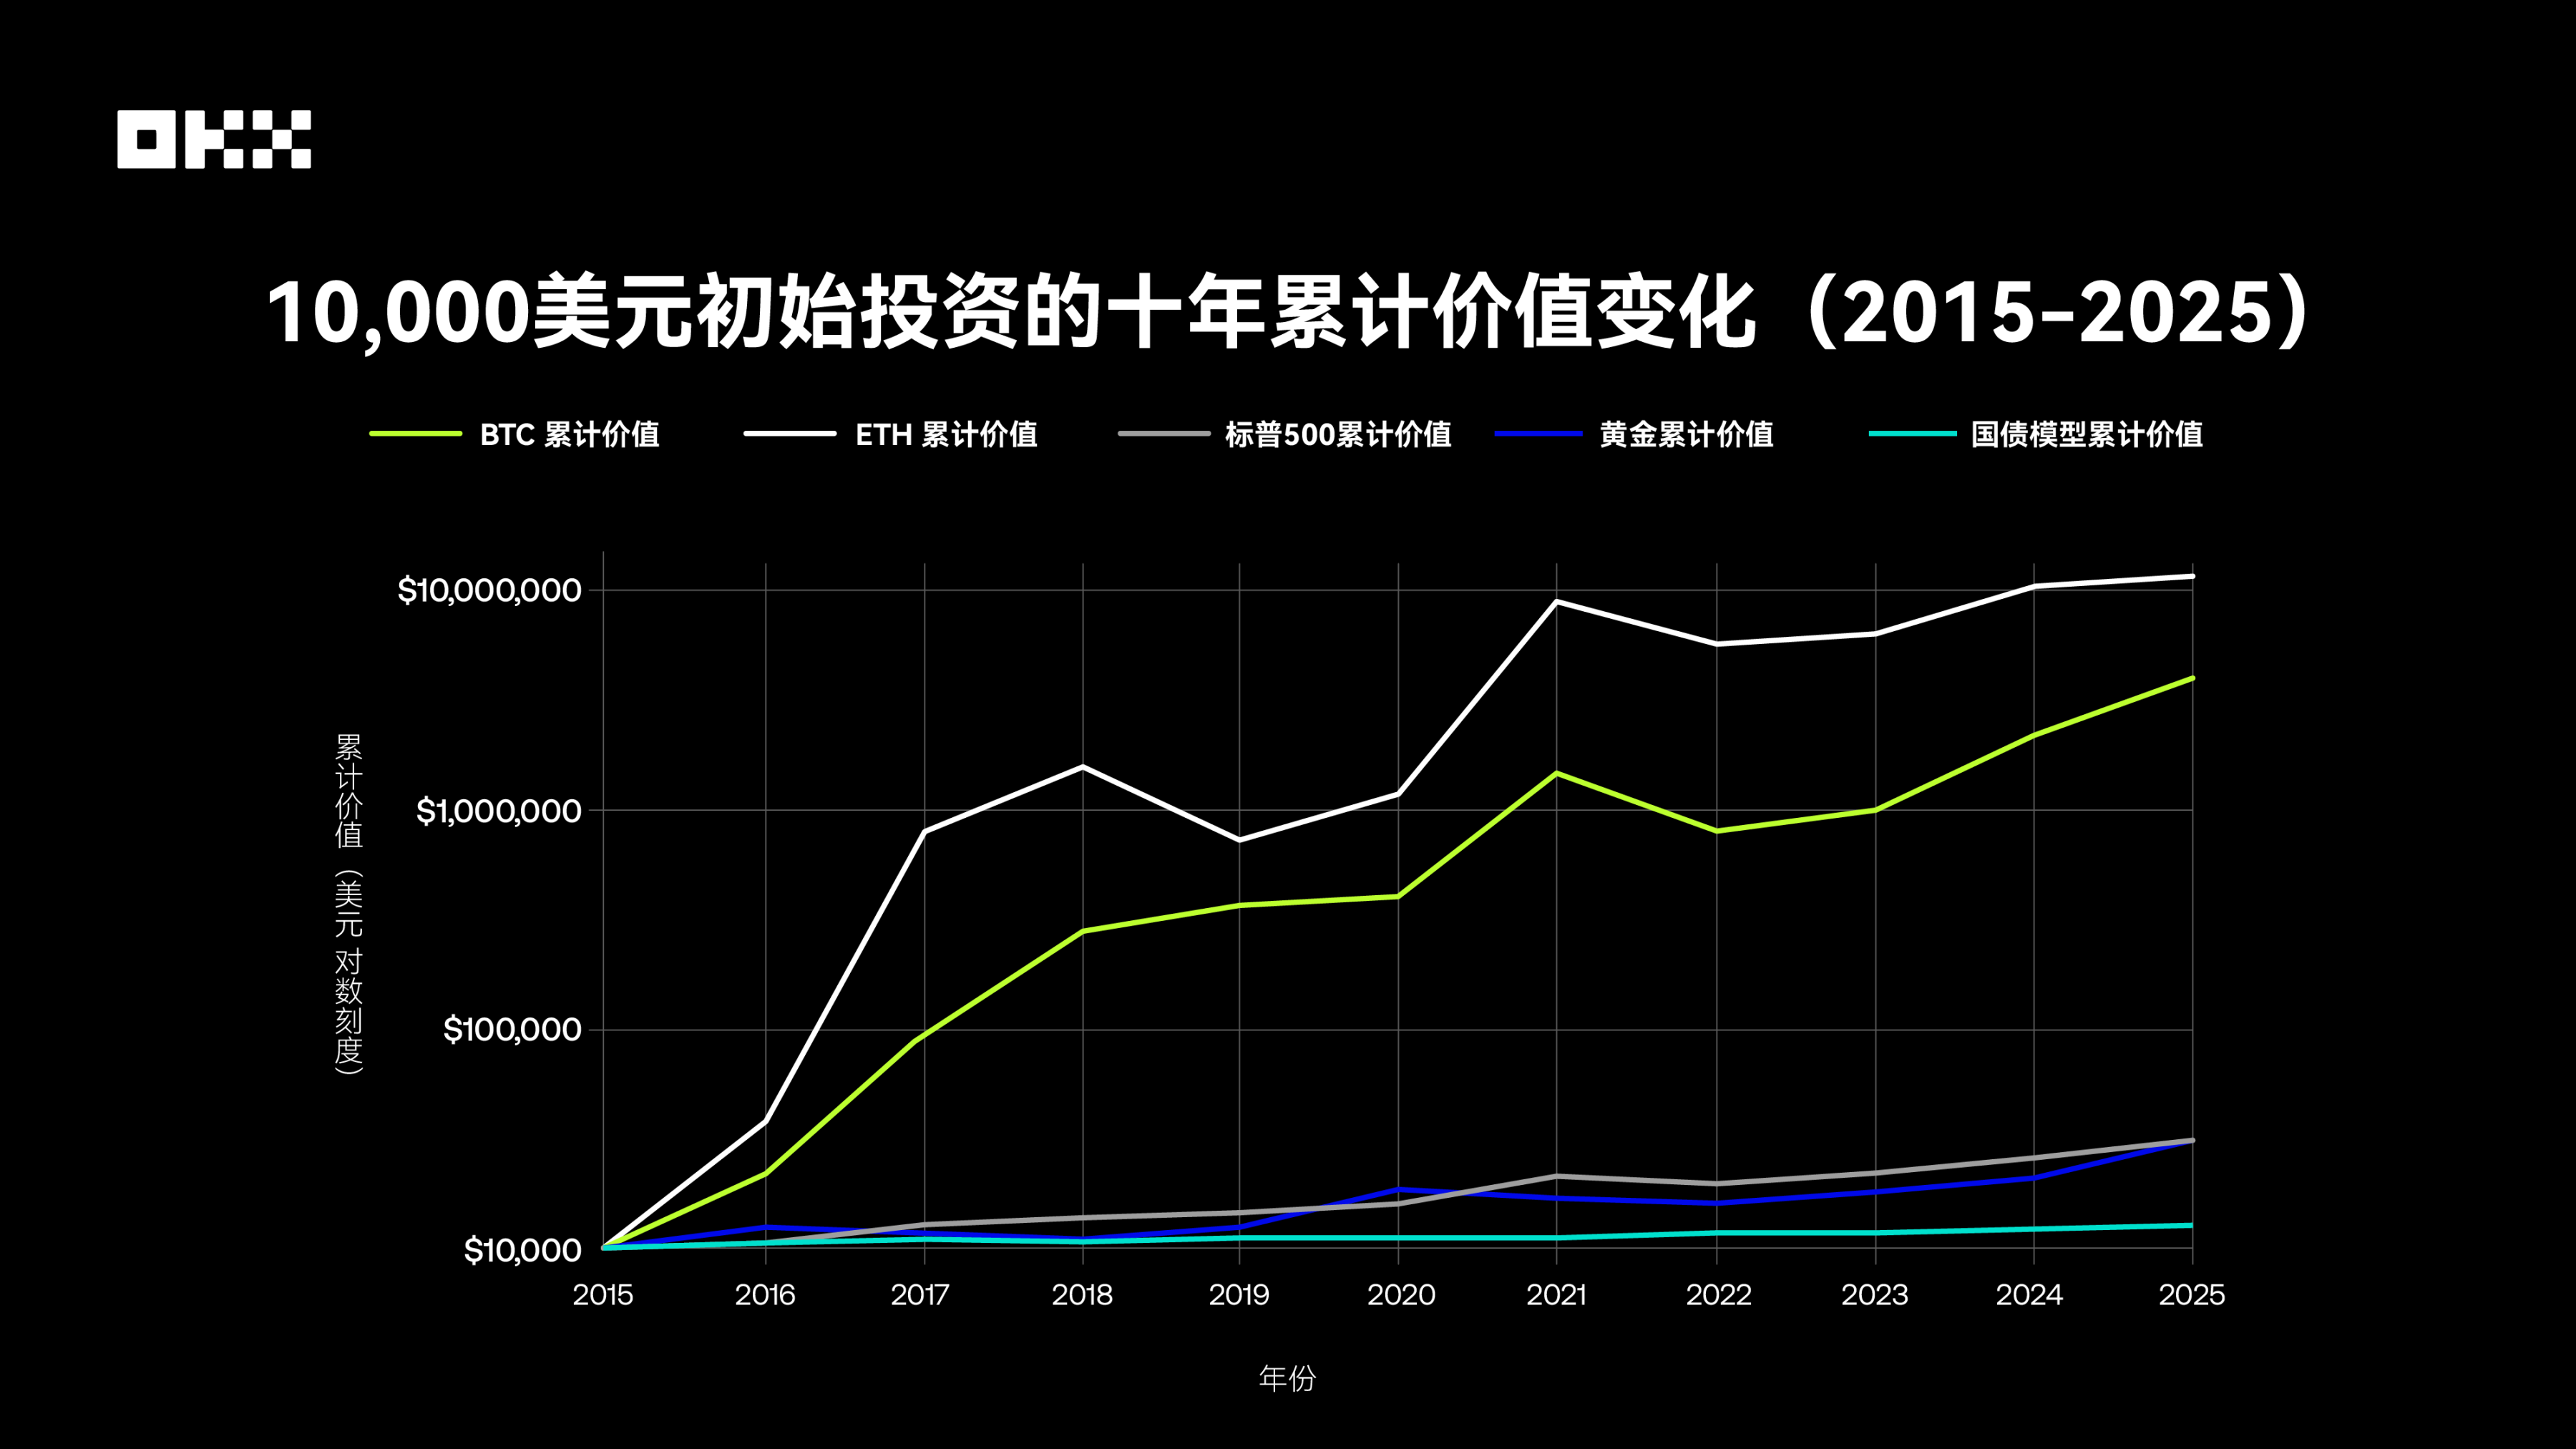
Among them, Bitcoin and Ethereum have demonstrated an astonishing wealth growth effect, with rates of return far exceeding those of traditional assets, reaching hundreds or even thousands of times. This reflects the asymmetric return potential of emerging technology assets under high risk, which is unimaginable in the traditional financial world. In comparison, the S&P 500 has tripled its investment thanks to its stable compound interest growth, and gold has played a greater role in preserving value. After experiencing a complete cycle of low and high interest rates, U.S. Treasury bonds have almost stagnated for 10 years, highlighting the constraints of interest rate risk on the long-term performance of bond assets.
Maximum drawdown, how high is the risk behind the returns?
No single asset consistently outperforms, and return rate is only the beginning of the story. A sophisticated trader is more concerned with the quality of returns—the level of risk taken to achieve those returns. Therefore, understanding the risk profile of different assets is as important as understanding their return potential. Using three core metrics—volatility, maximum drawdown, and Sharpe ratio—we can more comprehensively assess the true value for money of various assets. Volatility, typically measured by standard deviation, reflects the fluctuations in asset prices. Maximum drawdown, on the other hand, measures the maximum decline from an asset's historical high to its subsequent low. It is a direct indicator of downside risk and directly impacts a trader's psychological tolerance and the viability of their portfolio.
Data sources: Bloomberg, S&P Global, Yahoo Finance, etc.
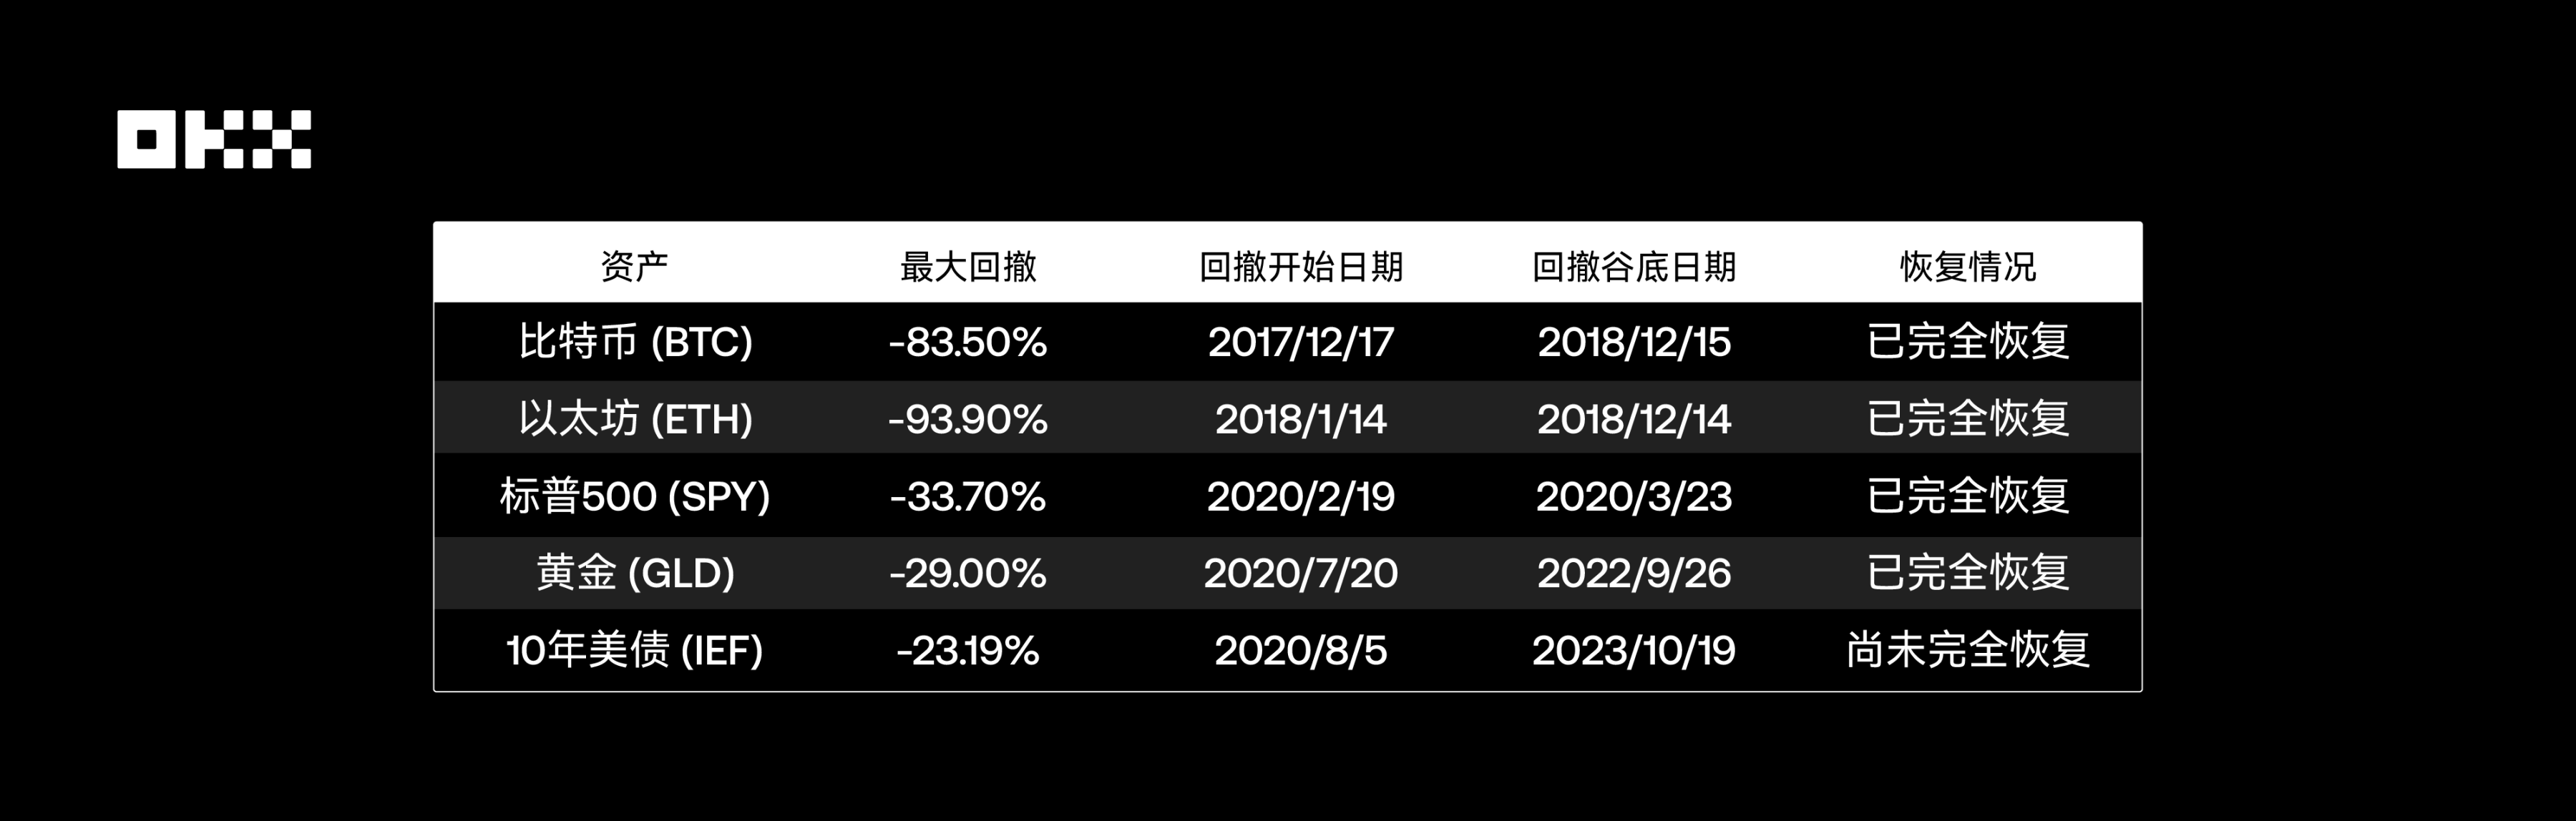
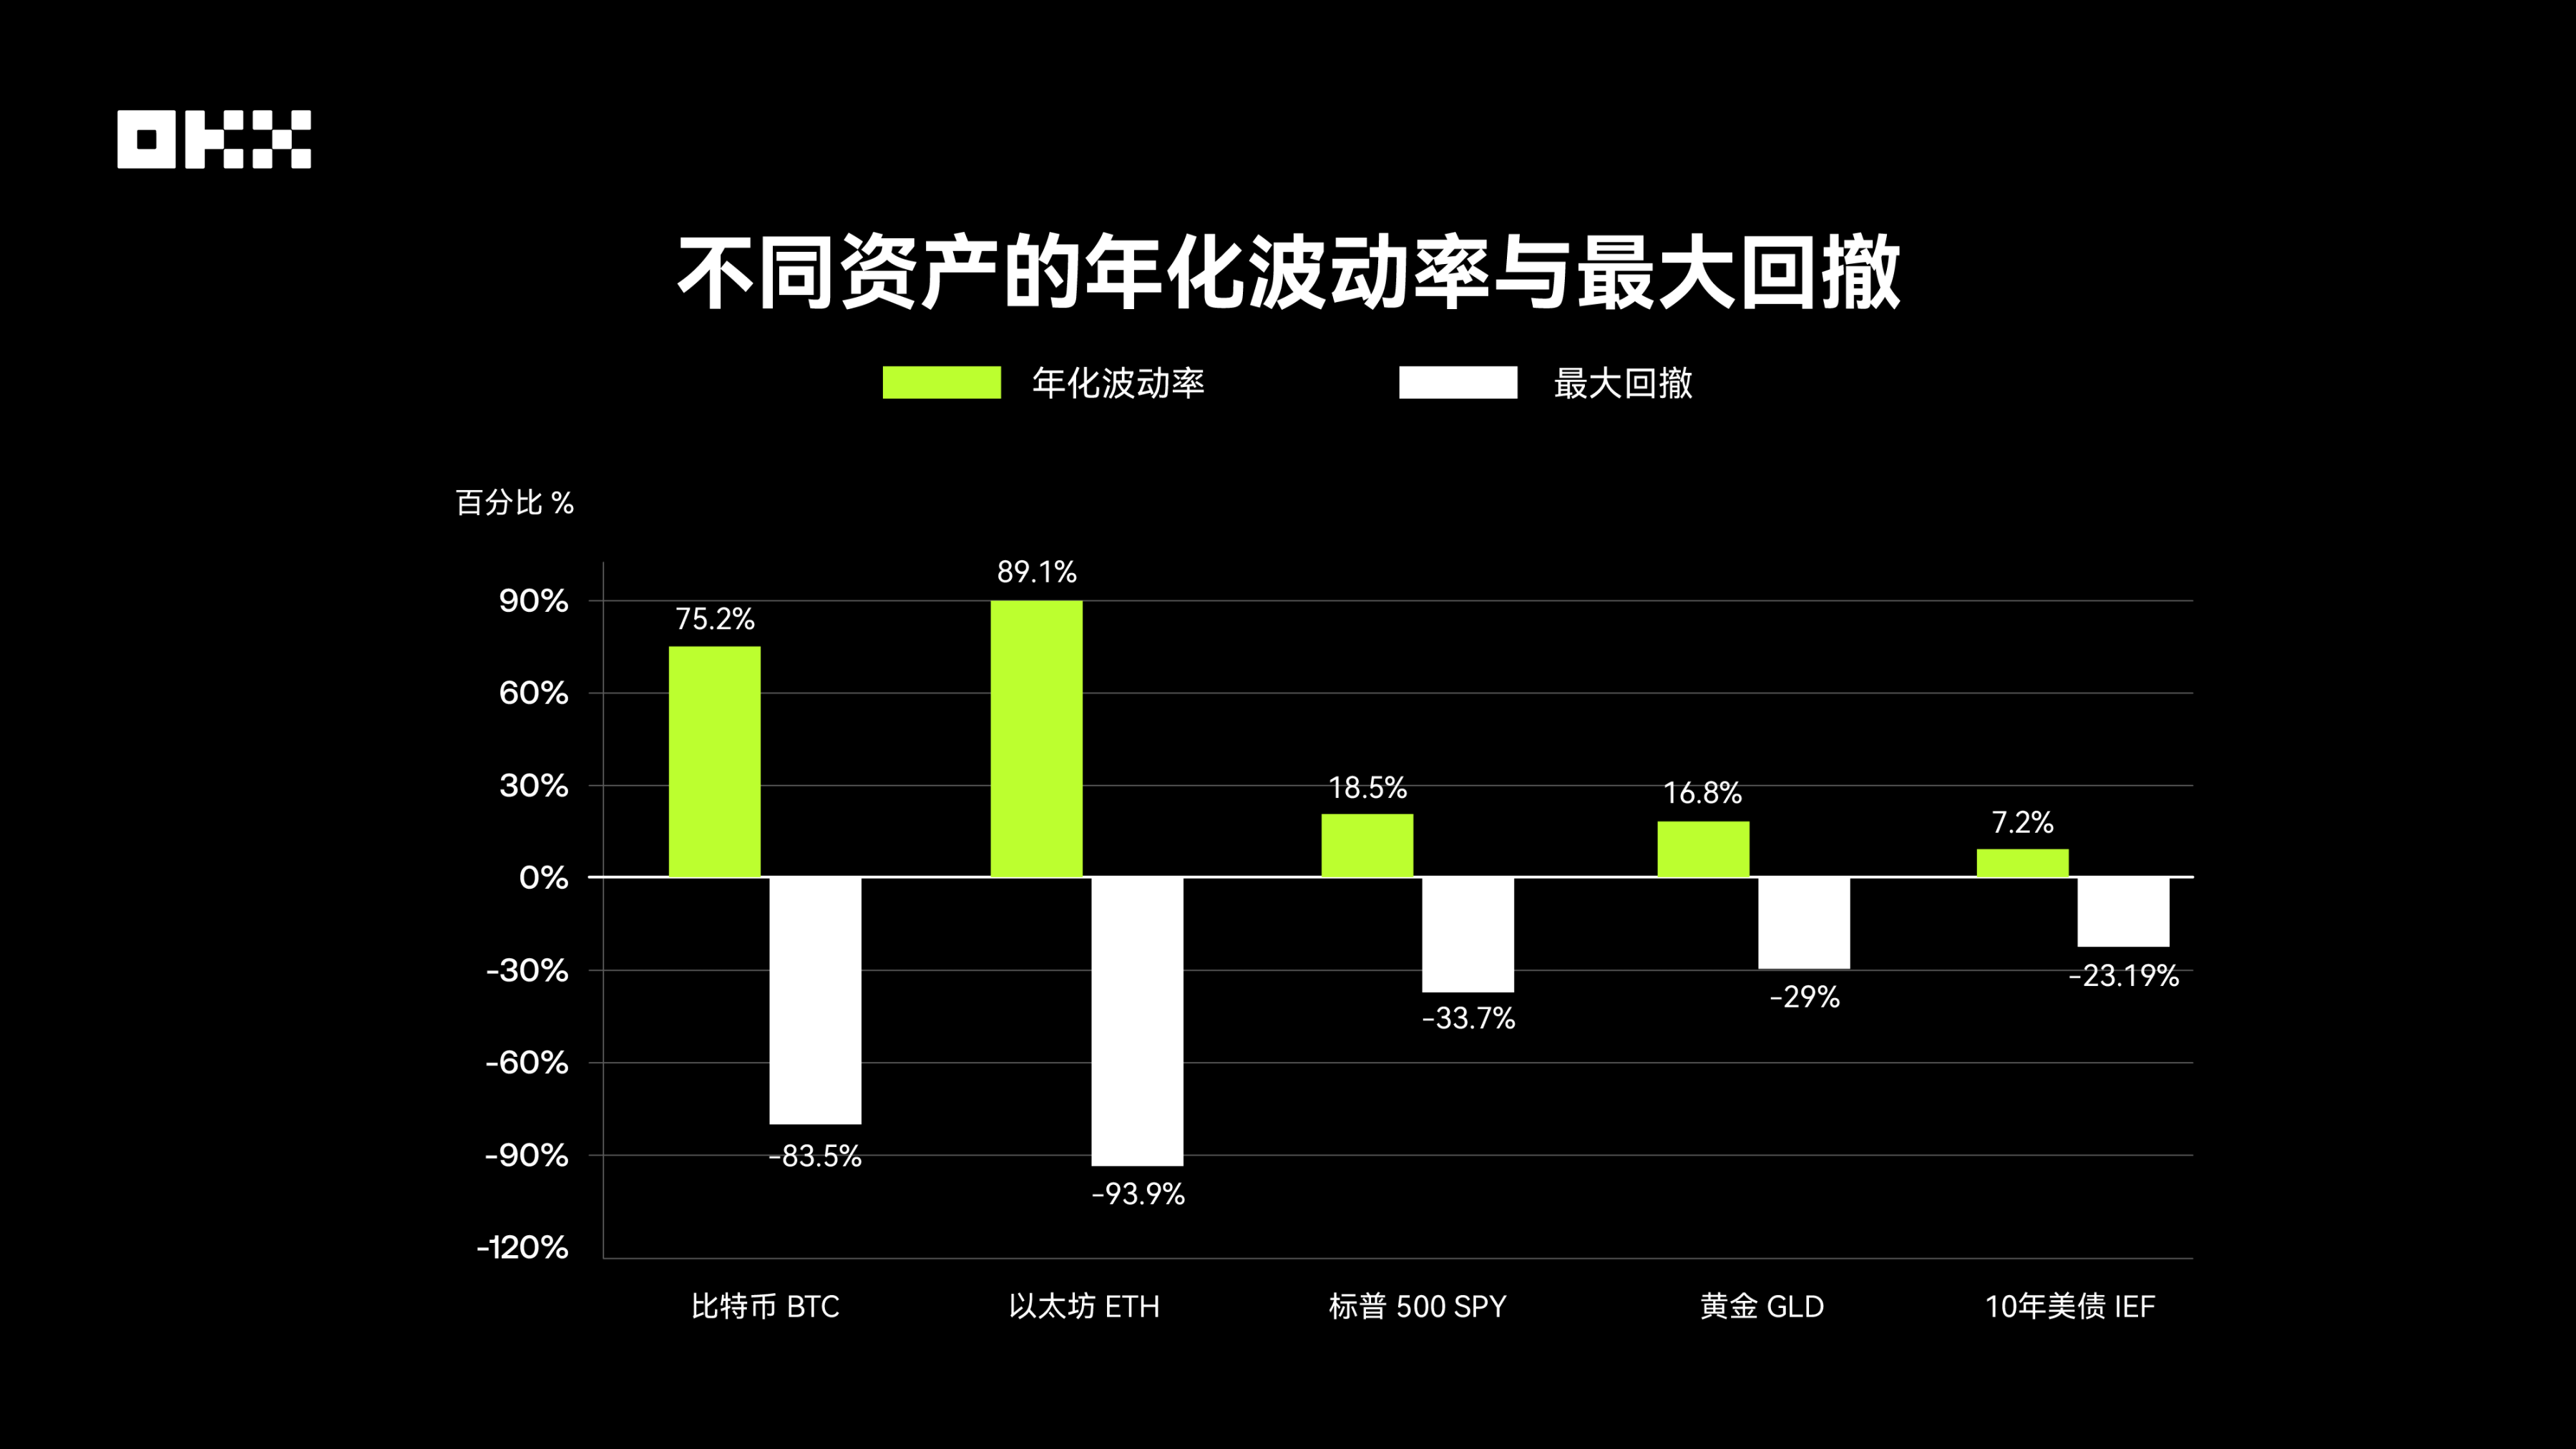
Crypto assets are far more volatile than traditional assets. According to Digital One Agency data, Bitcoin's annualized standard deviation is approximately 70%-90%, while the S&P 500's is only 15%-20%. This significant volatility directly leads to astonishing maximum drawdowns: Over the past decade, Bitcoin and Ethereum have experienced numerous deep drawdowns exceeding 70%. For example, during the 2018 bear market, BTC's price plummeted from nearly $20,000 to approximately $3,000, a drawdown exceeding 80%. The S&P 500's largest drawdown occurred in 2020, at the beginning of the COVID-19 pandemic, at approximately -34%. Historically, during the 2008 financial crisis, drawdowns exceeded 50%. Gold, on the other hand, has been relatively stable, with a maximum drawdown of approximately -29% over the past 15 years. U.S. Treasuries, as a safe-haven asset, have experienced the smallest drawdowns, but due to interest rate cycles, they have also experienced maximum drawdowns of approximately -23% during the rate hike cycle since 2020, shattering their "risk-free" reputation.
This data is alarming. Bitcoin and Ethereum users must be able to withstand an asset loss of more than 80% or even 90%, and wait more than two to three years to recover.
In addition, to comprehensively assess risk and return, we also introduce the Sharpe ratio and Karma ratio. The Sharpe ratio, proposed by Nobel Prize winner William Sharpe, is a leading international risk-adjusted return metric. It measures the excess return above the risk-free rate for each additional unit of total risk (measured by volatility) assumed. A higher Sharpe ratio indicates better performance for an asset with the same level of risk, and therefore more efficient trading.
The Karma ratio is another important risk-adjusted return metric, but it focuses more on measuring an asset's downside risk. It is calculated as the ratio of annualized return to its maximum historical drawdown. A higher Karma ratio indicates an asset's resilience or value for money when enduring its worst historical drawdown. This metric is particularly popular among those focused on risk management.
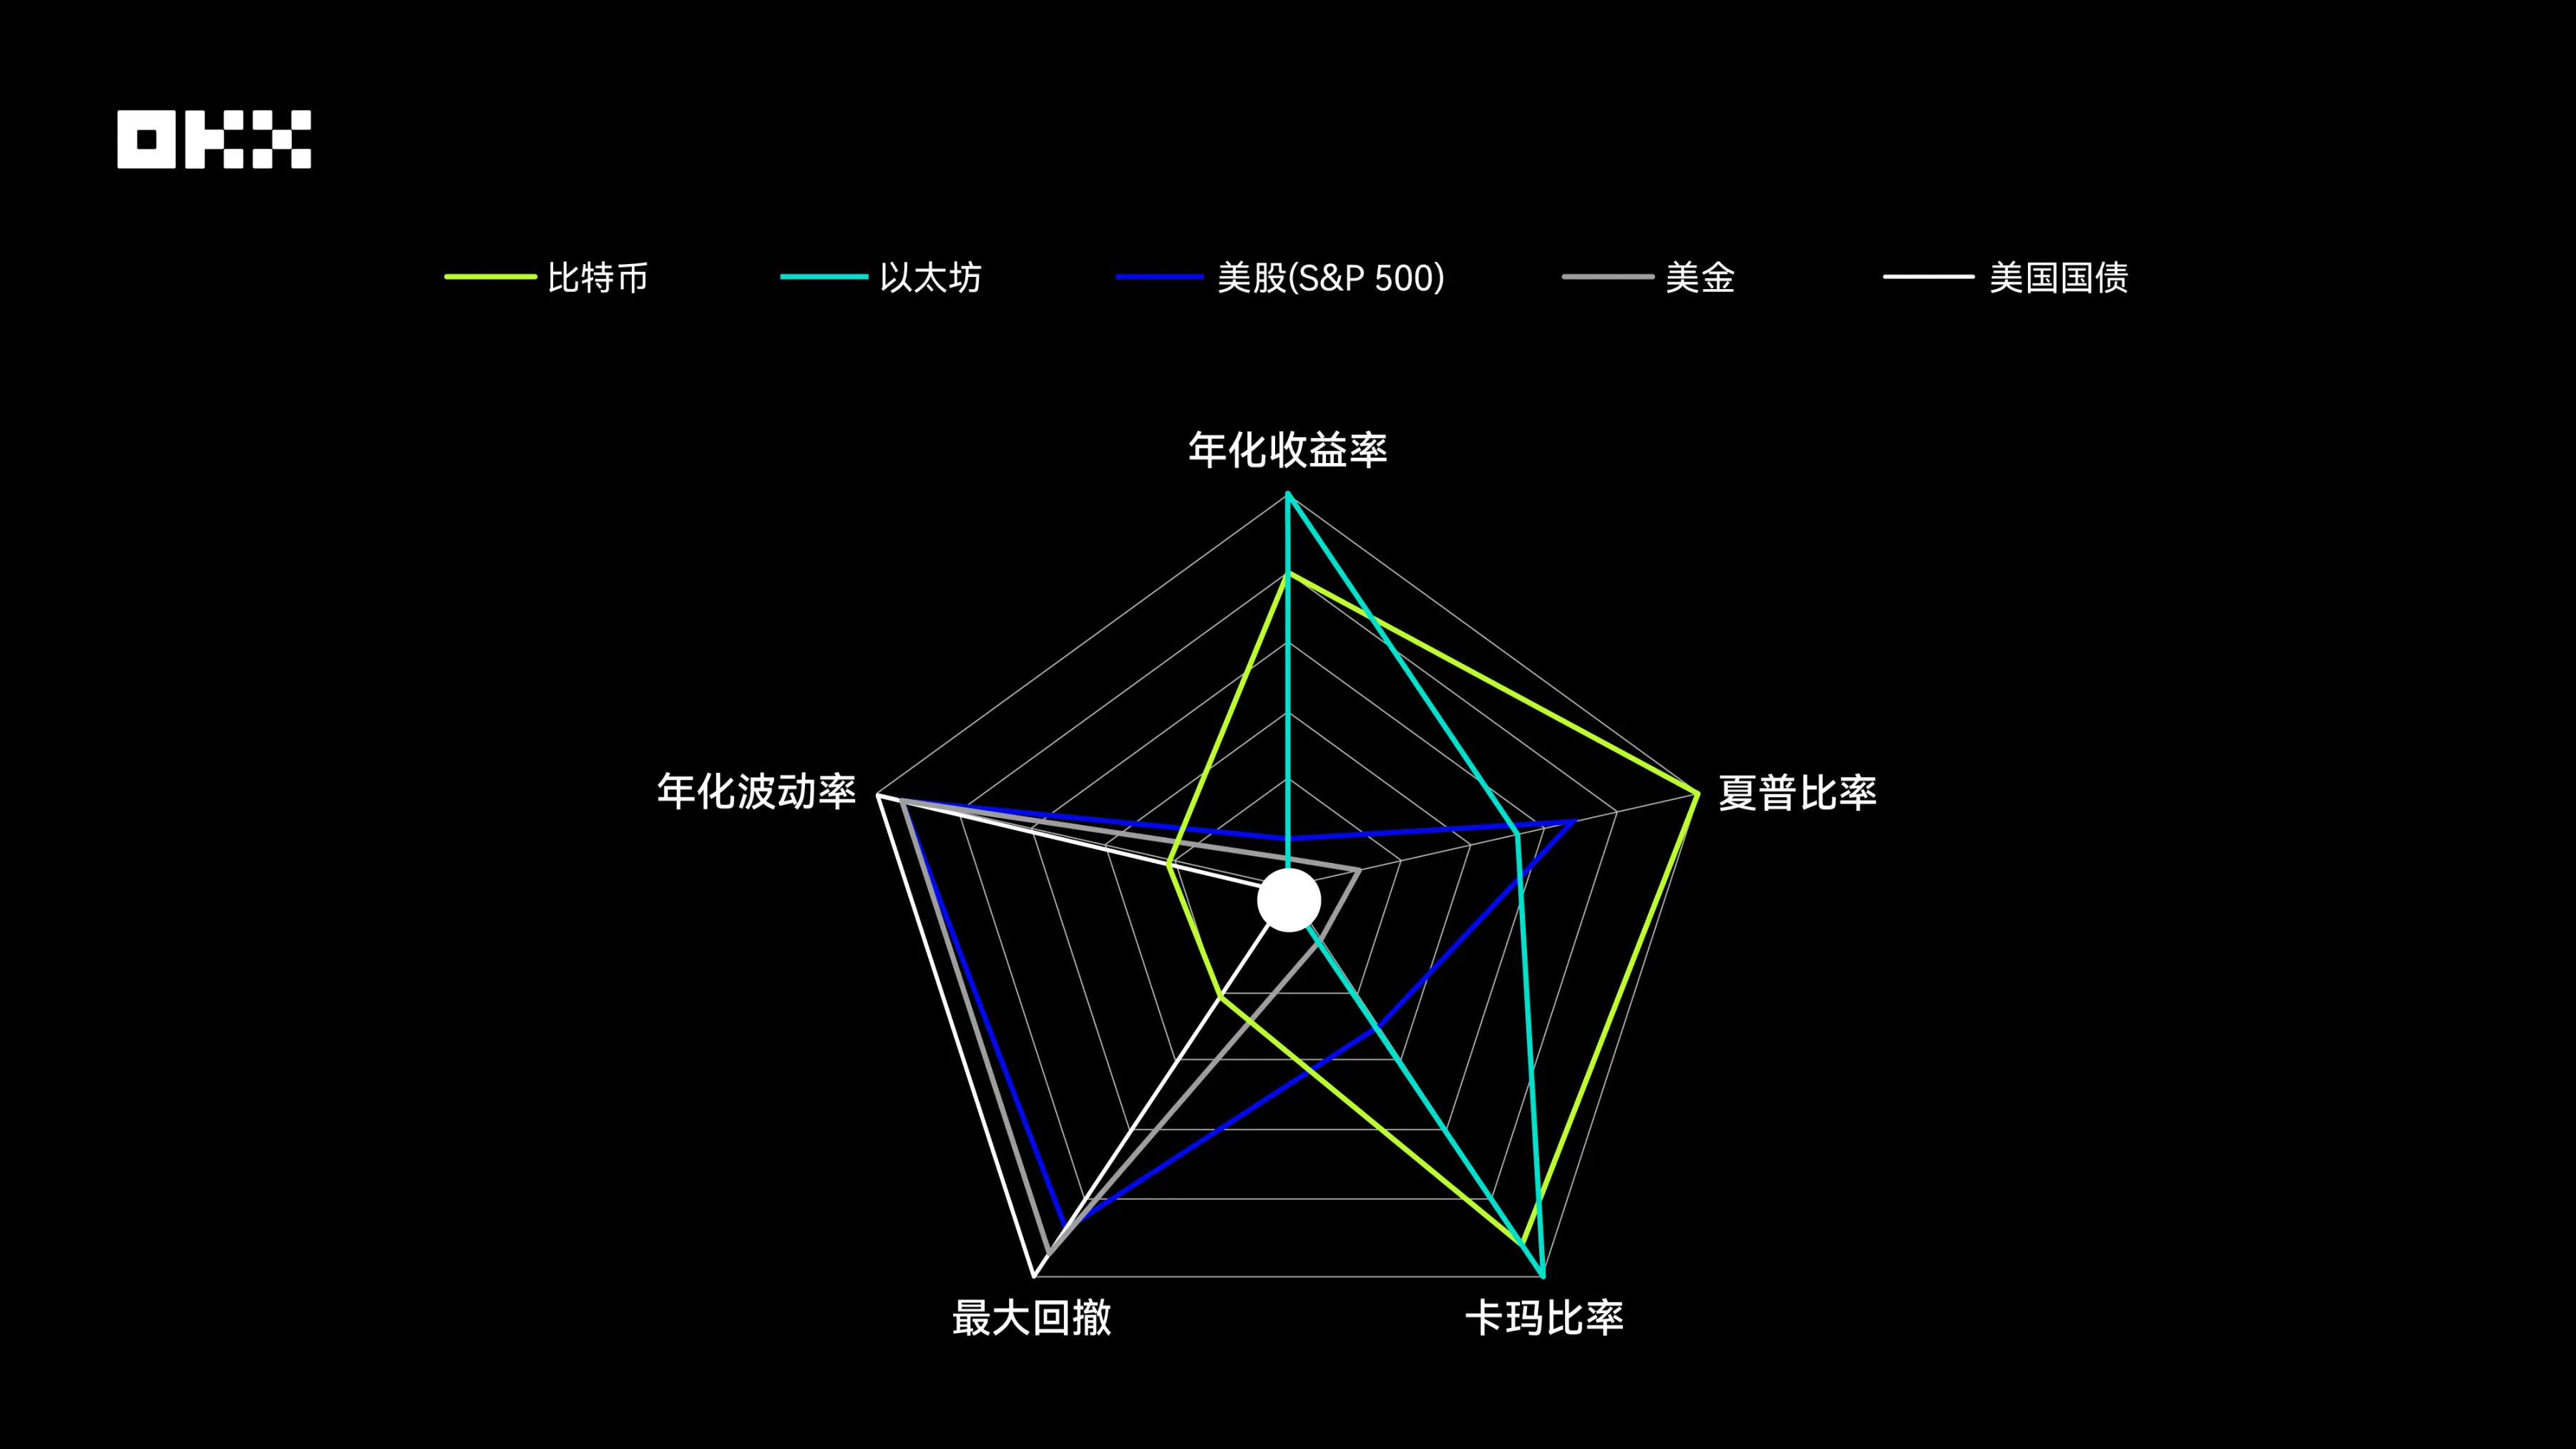
Bitcoin and Ethereum exhibit the most aggressive radar chart shapes. They demonstrate unparalleled advantages in annualized yield and Karma ratio, forming two sharp, outward-pointing corners. This reflects their remarkable wealth-building effect and robust resilience over the past decade. However, this high return comes at a price. Their scores for maximum drawdown and annualized volatility are the lowest of all assets, meaning their charts are severely inward-facing in both directions, creating significant weaknesses. This clearly reveals the high-risk, high-volatility nature of crypto assets. Notably, Bitcoin's Sharpe ratio outperforms Ethereum's, indicating a slightly more efficient investment after risk adjustment.
The radar chart for the US stock market (S&P 500) presents a relatively balanced pentagon, covering a considerable area. It exhibits neither significant weaknesses nor extreme strengths across all five dimensions. Its Sharpe ratio is outstanding, second only to Bitcoin, demonstrating excellent risk-adjusted returns. Furthermore, its annualized returns are robust, while volatility and maximum drawdown are well-controlled, far outperforming crypto assets. This portrays a classic "core asset": capable of providing substantial long-term returns while keeping risk within a relatively reasonable range, making it a cornerstone of a portfolio.
Gold's radar chart shape leans towards risk control. Its high scores for annualized volatility and maximum drawdown indicate relatively stable prices and strong resilience to price fluctuations. However, its performance in three return-related metrics—annualized return, Sharpe ratio, and Karma ratio—is relatively mediocre. This is consistent with gold's positioning as a traditional safe-haven asset: not a tool for high growth, but rather a store of value and risk hedging tool during market turmoil. The smaller area of the chart also reflects its relatively low overall return efficiency.
The radar chart for U.S. Treasuries has the smallest area of any asset class, with its shape constricted at the center. It scores highest in the two risk dimensions of annualized volatility and maximum drawdown, demonstrating exceptional stability. However, it scores lowest in all return-related dimensions. This clearly demonstrates that, amidst the macroeconomic backdrop of declining interest rates over the past decade, U.S. Treasuries have primarily served as a capital preservation and liquidity provider, acting as a "ballast" in a portfolio rather than a return generator. Their extremely low risk and extremely low return create a stark contrast.
Correlation between assets, how to optimize asset portfolio?
The core of a diversified portfolio lies in including assets with low correlation. When one asset declines, another is likely to rise or remain stable, thus smoothing out the volatility of the entire portfolio. When Bitcoin was first introduced, it had virtually no correlation with traditional financial markets and was considered a perfect "diversifier." However, this characteristic has changed significantly over the past decade, especially with the acceleration of institutionalization.
The correlation coefficient measures the degree to which two asset prices move in the same direction, ranging from -1 (perfect negative correlation) to +1 (perfect positive correlation). An effectively diversified portfolio typically consists of assets with low or negative correlation. The following table, compiled from data from multiple research institutions, shows the approximate correlations between various assets over the past decade.
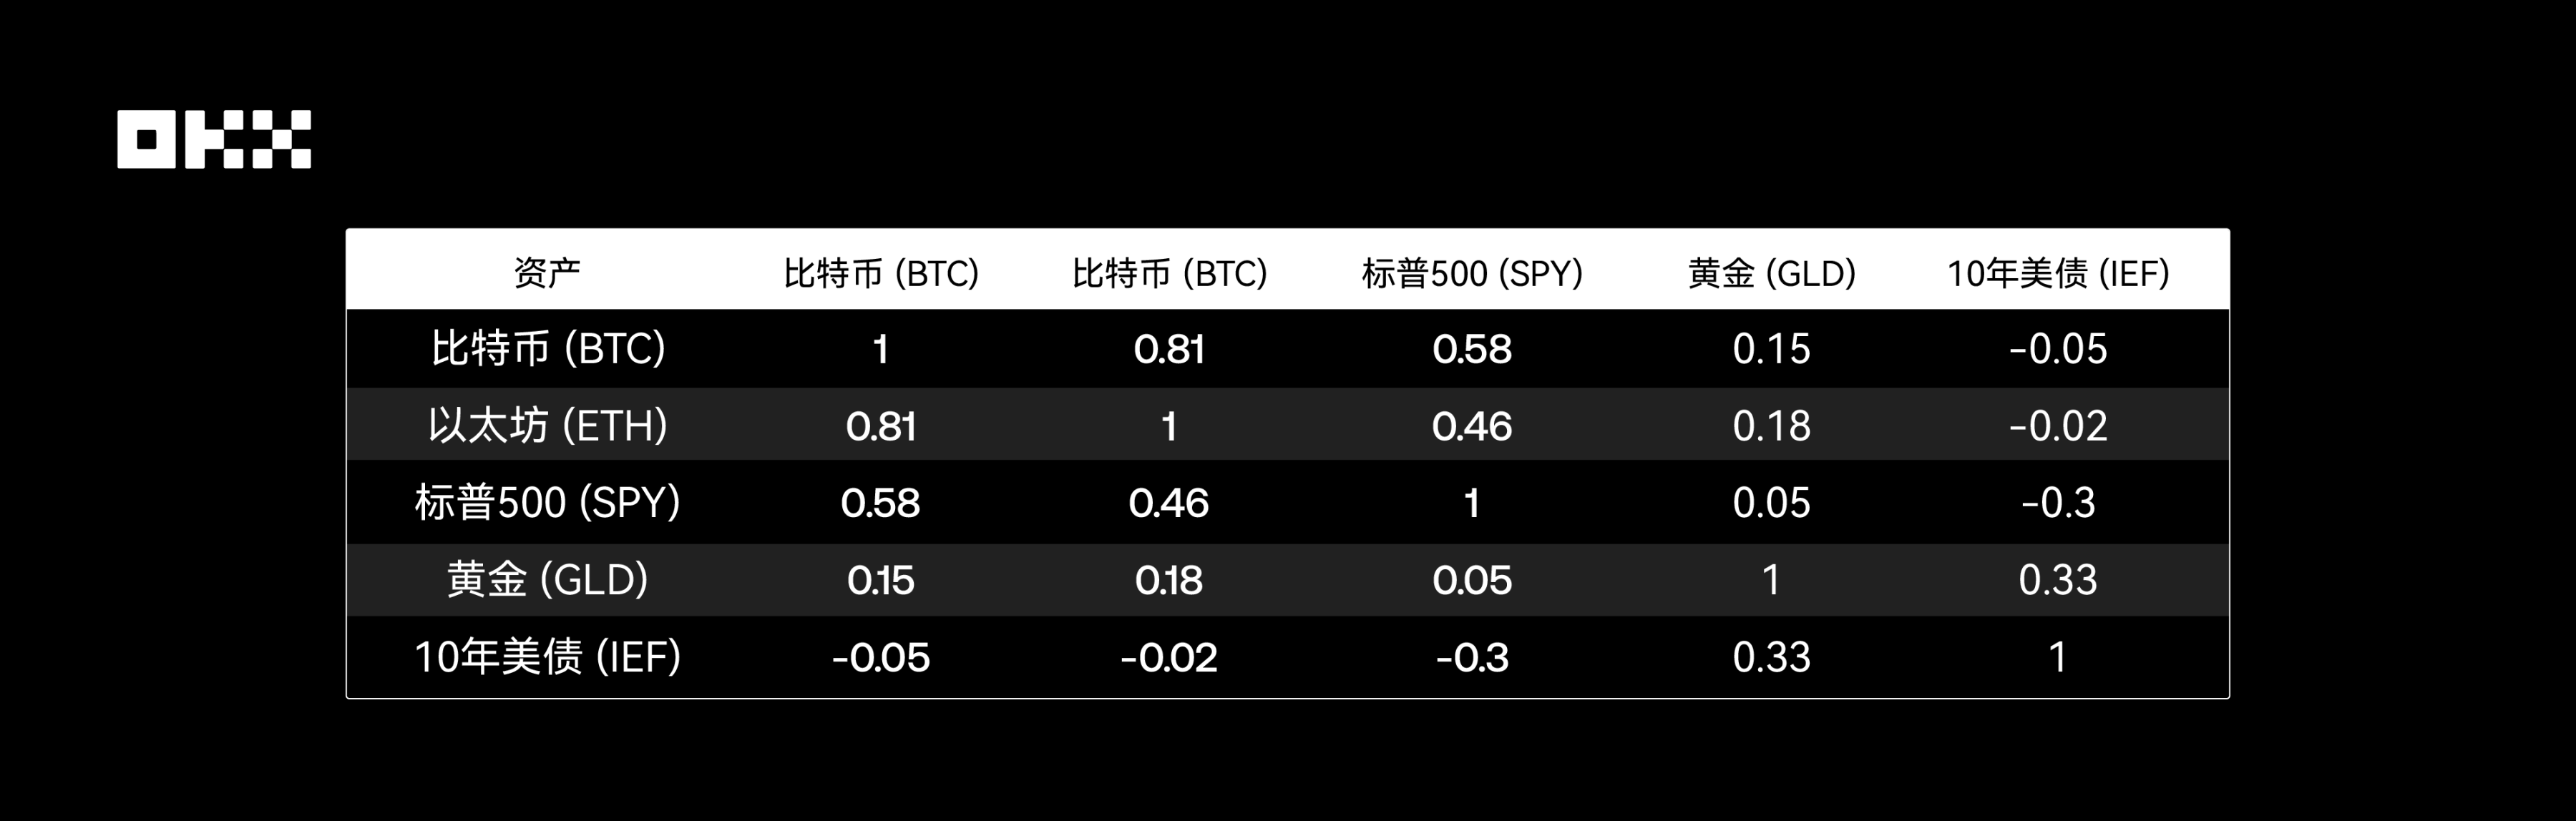
Data Source: Crypto Research Report, LSEG, Newhedge
Bitcoin vs. S&P 500: From independence to synchronization. This is one of the most significant changes of the decade. Before 2020: The correlation between crypto assets and traditional assets was generally low and unstable, often fluctuating between positive and negative, demonstrating strong independence. 2020-2021: During the pandemic and monetary easing period, as global central banks implemented large-scale liquidity injections, the "rising tide lifts all boats" effect was significant for all risk assets. During this period, the correlation between Bitcoin and the S&P 500 (especially tech stocks) rose sharply, at one point exceeding 0.6, demonstrating a strong "coupling" phenomenon. This suggests that in a macro liquidity-driven market, Bitcoin is more like a high-beta risk asset than a safe haven.
2022-2023: A cycle of interest rate hikes and tightening. As the Federal Reserve embarks on an aggressive rate hike cycle, risk assets are generally under pressure. The correlation between Bitcoin and the S&P 500 remains high, with both prices declining. However, its negative correlation with the US Dollar Index (DXY) has significantly strengthened, and Bitcoin prices tend to come under pressure when the US dollar strengthens. 2024-2025: The ETF era. The approval of a US spot Bitcoin ETF is seen as a structural inflection point. On the one hand, it strengthens the connection between the crypto market and the traditional financial system; on the other hand, the continued inflow of funds brought by the ETF may become a pricing factor independent of macroeconomic sentiment, causing the correlation to shift again. Data shows that after the ETF approval, the correlation between Bitcoin and the S&P 500 has declined, indicating some signs of "decoupling."
Bitcoin vs. Gold: The Challenge of the "Digital Gold" Narrative. Although Bitcoin is hailed as "digital gold" due to its fixed supply, data shows that its safe-haven properties and correlation with physical gold are unstable. Research by the European Securities and Markets Authority (ESMA) indicates that there is no clear and stable relationship between the two. In particular, during periods of market panic, Bitcoin tends to fall alongside risky assets rather than providing the same kind of protection as gold.
Internal relationships of traditional assets: The classic negative correlation or low correlation between gold, US Treasury bonds and the S&P 500 remains the cornerstone of traditional asset allocation, providing important stability for asset portfolios.
How do the five major assets perform under the impact of major events?
Long-term averages can mask extreme performance at critical moments. By analyzing a few key events, we can gain a deeper understanding of the true "stress response" of various assets.
(I) March 2020: COVID-19 Black Swan Event, Indiscriminate Sell-off in Global Markets
In March 2020, the COVID-19 pandemic triggered panic in global financial markets, known as "Black March." This extreme liquidity crisis saw an indiscriminate sell-off of virtually all assets. The S&P 500 plunged into a bear market in just 16 trading days, the fastest decline on record, with a maximum drawdown of -34%. Bitcoin was no exception, with its price plummeting nearly 50% in a single day on March 12, from approximately $8,000 to below $4,000. Gold (GLD) was also not immune, falling in the short term as users sold assets in exchange for US dollar liquidity. Only US Treasuries, the ultimate safe haven, remained resilient. This event profoundly revealed that during periods of extreme de-risking, correlations converge toward 1, leaving Bitcoin's "digital safe haven" narrative vulnerable to the drying up of liquidity.
(II) May & November 2022: Crypto native crisis, LUNA & FTX collapse brings devastating blow
2022 was a "disaster year" for the crypto industry. In May, the collapse of the algorithmic stablecoin TerraUSD (UST) and its sister token LUNA wiped out nearly $50 billion in market capitalization in a matter of days. In November of the same year, the sudden bankruptcy of FTX, the world's second-largest crypto exchange, further exacerbated market panic. These two events are classic examples of "endogenous" crypto crises. Research shows that after the FTX collapse, the prices of both Bitcoin and Ethereum fell by over 20%, while assets closely related to the FTX ecosystem saw even greater declines. However, during these events, traditional financial markets such as gold, the S&P 500, and US Treasuries remained largely unaffected, clearly demonstrating the risk isolation between the crypto market and traditional finance. This demonstrates that crypto assets face not only macroeconomic risks but also unique and potentially more devastating internal protocol, platform, and trust risks.
(III) 2020-2025: Macroeconomic policy shifts to a cyclical pattern, and the tide of liquidity
The Federal Reserve's monetary policy is the "master valve" of global liquidity. Under the massive quantitative easing and zero interest rate policy of 2020-2021, ample liquidity flowed into risky assets, ushering in a major bull market for both Bitcoin and the S&P 500. However, since March 2022, when the Fed began an aggressive cycle of interest rate hikes to combat inflation, global liquidity has tightened, and risky asset prices have plummeted. Academic research shows that Bitcoin's price sensitivity to the Fed's interest rate decisions and monetary policy uncertainty (MPU) has significantly increased since 2020. This further demonstrates Bitcoin's deep integration into the macro-financial framework, with its price fluctuations closely linked to Fed policy expectations.
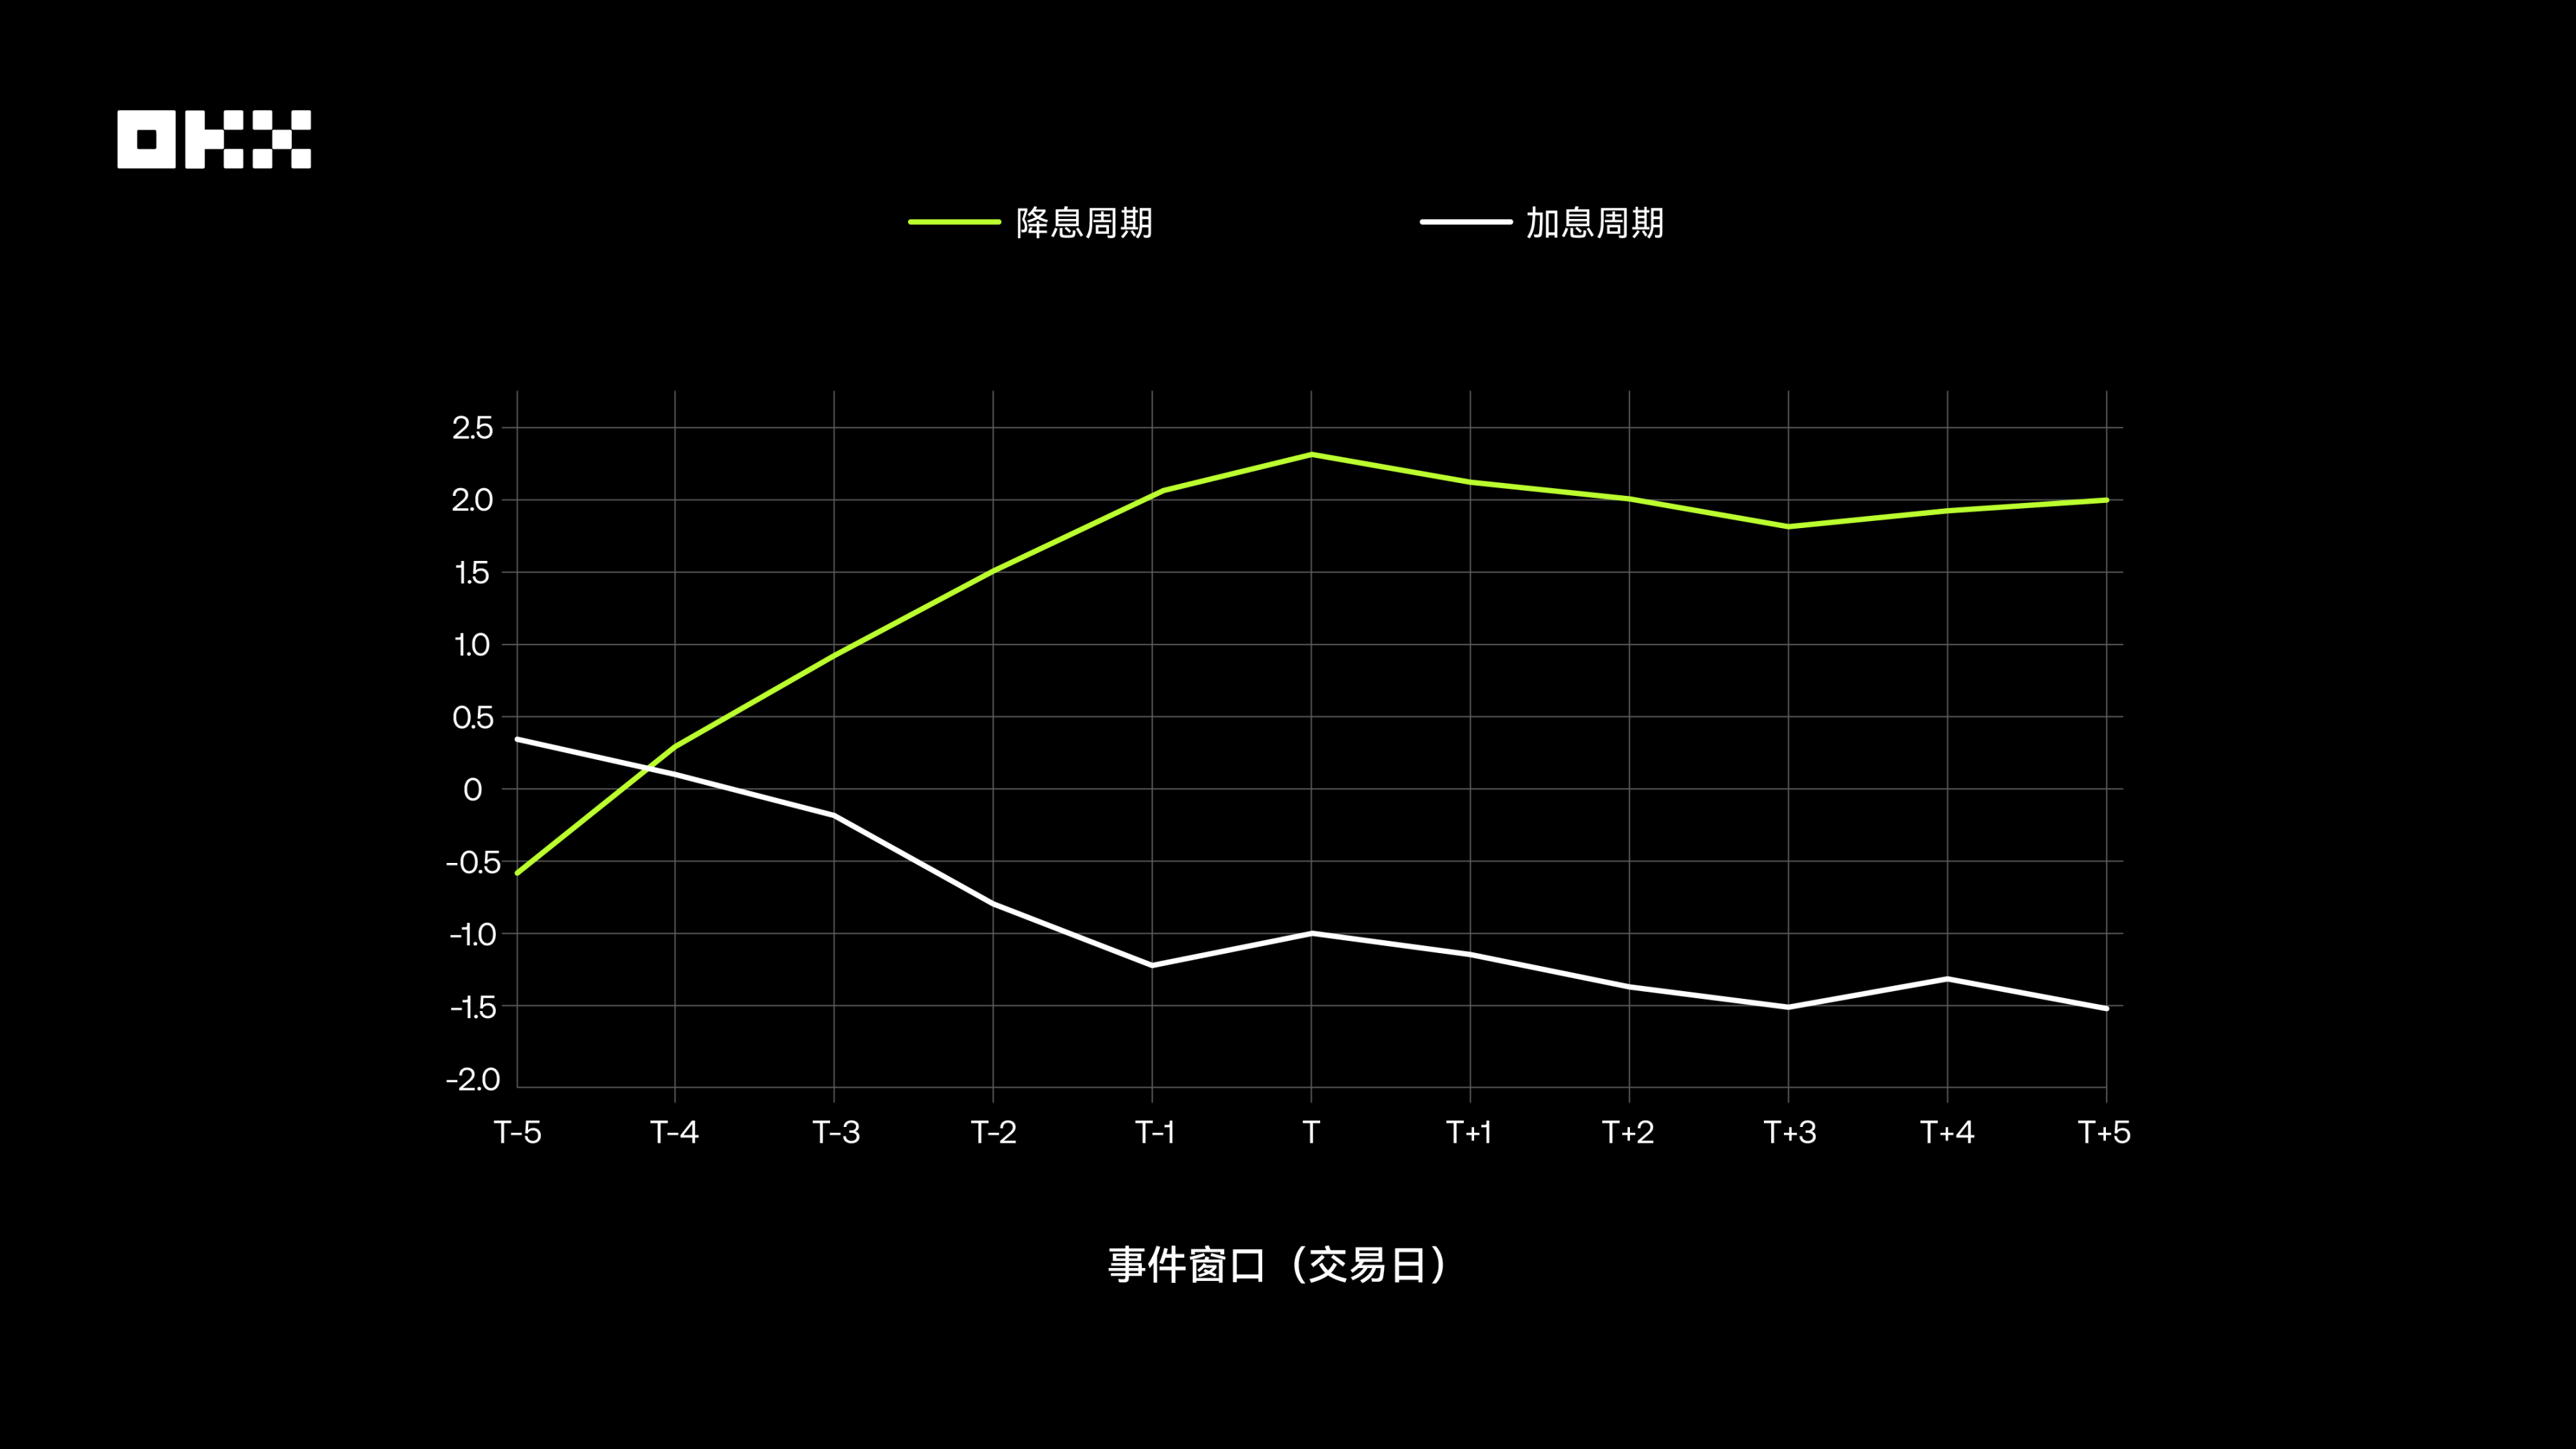
Furthermore, research has found that the Bitcoin market exhibits significant "expectation trading" characteristics. Before a rate hike decision is announced, the market often already prices in the expectation, leading to pre-emptive pressure on Bitcoin prices. Conversely, when expectations of a rate cut are strong, prices tend to rise in advance. On the day of the decision's announcement, if the result is in line with expectations, the market reaction is typically muted. The truly dramatic fluctuations arise from "interest rate surprises"—when the FOMC's decision deviates from market expectations priced in through instruments like interest rate futures.
The chart below shows Bitcoin's average cumulative excess return (CAR) relative to the S&P 500 during the interest rate hike and cut event window (T-5 to T+5 days). It can be seen that during rate cut cycles, Bitcoin has a significant positive excess return before the decision is announced, while during rate hike cycles, this is less pronounced, or even negative. This suggests that the market reacts more actively and preemptively to rate cuts.
(IV) January 2024: Bitcoin spot ETF approved, a milestone towards mainstream adoption
On January 10, 2024, the U.S. Securities and Exchange Commission (SEC) officially approved the listing of the first Bitcoin spot ETFs, a milestone seen as the legalization and mainstreaming of crypto assets. The launch of ETFs significantly lowered the barrier to entry for traditional users. Data shows that following the ETF approval, Bitcoin trading volume soared and capital inflows surged. A Chainalysis chart shows that following the ETF's launch, its daily trading volume reached nearly $10 billion in March, with cumulative inflows far exceeding the performance of the first gold ETF launched in 2005. This event not only drove Bitcoin prices to new highs, but more importantly, it is structurally altering Bitcoin's user base and market dynamics, making its connection with the traditional financial system ever closer.
There is no perfect asset, build an asset portfolio that can cross cycles
BTC/ETH has been the undisputed "growth king" of the past decade, delivering exceptional returns unmatched by any traditional asset. However, this return comes at the cost of extreme volatility and significant drawdowns. Its increasing correlation with traditional markets diminishes its value as a pure diversification tool. It is suitable for those with a high risk tolerance and a strong long-term commitment.
The S&P 500 is the cornerstone of a long-term portfolio. It provides excellent, sustainable compound growth and, after risk adjustment, exhibits optimal balance in both the Sharpe Ratio and the Karma Ratio. While subject to periodic pullbacks, its strong resilience and the support of the real economy make it an absolute core asset for portfolio construction.
As an ancient store of value, gold offers limited absolute returns, but it remains an indispensable "insurance policy" amidst macroeconomic uncertainty, geopolitical risks, and questions about the credit-based monetary system. Its value in an asset portfolio lies not in offense but in defense.
The traditional "safe haven" status of U.S. Treasuries has been severely challenged during this unprecedented cycle of interest rate hikes, reminding users that "risk-free" is only a relative concept. Despite this, they remain one of the most liquid and credit-rated assets globally, and their fundamental role in providing stability and liquidity in asset portfolios will be difficult to replace in the short term.
So, this classic question also has an answer: should you choose a fixed investment strategy or a one-time investment strategy?
In the long run, a regular investment strategy has shown significant advantages for highly volatile assets (BTC/ETH). By purchasing more shares during price troughs, regular investment effectively smooths costs, reduces timing risk, and ultimately yields very substantial returns, all with far less psychological pressure than a one-time investment.
For stable growth assets (SPY), due to the long-term upward trend of the stock market, the one-time investment strategy has performed better than the fixed investment strategy for most of the time in history because it allows funds to enjoy the market's compound growth earlier and more fully.
For low-growth assets (GLD/IEF), the two strategies yielded similar results, with neither delivering explosive returns. The conclusion is that regular investment is an effective strategy for managing high-volatility assets like Bitcoin, while for equity markets with stable long-term growth, an early, all-in investment is generally a better option. Whether you prefer a basic regular investment strategy, smart arbitrage, a short-term grid strategy, or advanced signal or iceberg strategies, OKX Strategy Trading can meet your needs in one place.
The "holy grail" of asset allocation isn't finding a single optimal asset, but rather deeply understanding and skillfully combining the unique characteristics of different assets. A robust portfolio should leverage the sharpness of crypto assets to generate excess returns, rely on the depth of equity assets to drive long-term growth, and employ the stability of gold and bonds to mitigate against unknown risks. Ten years of data tell us: the market is constantly evolving, and there are no eternal winners. The true "king of assets" may not reside in any single specific asset, but rather within a rational trading framework that deeply understands and harnesses the unique characteristics of different assets.