summary
- The on-chain ecosystem is rapidly differentiating, with Solana maintaining its high-frequency dominance and Ethereum consolidating its high-value position. The capital flow structure is evolving towards "the strong get stronger", with emerging public chains performing well, while some side chains and L2 are facing pressure from capital withdrawal.
- Ethereum continues to maintain its position at the core of the public chain with a net inflow of over US$2 billion and record highs in both price and institutional allocation. Emerging public chains are attracting capital and rising, while side chains such as Polygon are experiencing large-scale capital outflows, showing a pattern of "the strong getting stronger."
- After Bitcoin reached a high of $124,000, the capital inflow slowed down, but the selling pressure was mild, the cost basis support was solid, and the unrealized losses remained low. Overall, it showed that the current pullback was a stage correction rather than a trend reversal.
- Aave continues to dominate the decentralized lending space, and by launching the Horizon platform to enter the institutional-grade RWA mortgage lending market, it further strengthens its core position in the integration of DeFi and traditional finance.
- BIO has rapidly risen in the DeSci field thanks to its V2 upgrade and ecological expansion. The token market value and pledge volume have soared simultaneously, and on-chain funds have accelerated inflows, demonstrating its potential to continue to lead decentralized scientific research.
On-chain data summary
Overview of on-chain activities and capital flows
In addition to analyzing overall on-chain capital flows, we further selected several key on-chain activity metrics to assess the true usage and activity of various blockchain ecosystems. These metrics include daily transaction volume, daily gas fees, daily active addresses, and net cross-chain bridging traffic, encompassing multiple dimensions such as user behavior, network usage intensity, and asset liquidity. Compared to simply observing capital inflows and outflows, these on-chain native data can more comprehensively reflect the fundamental changes in the public chain ecosystem, helping to determine whether capital flows are driven by actual usage demand and user growth, thereby identifying networks with sustainable development foundations.
Trading Volume Analysis: Ethereum Continues to Hit New Highs, Solana Remains at the Top
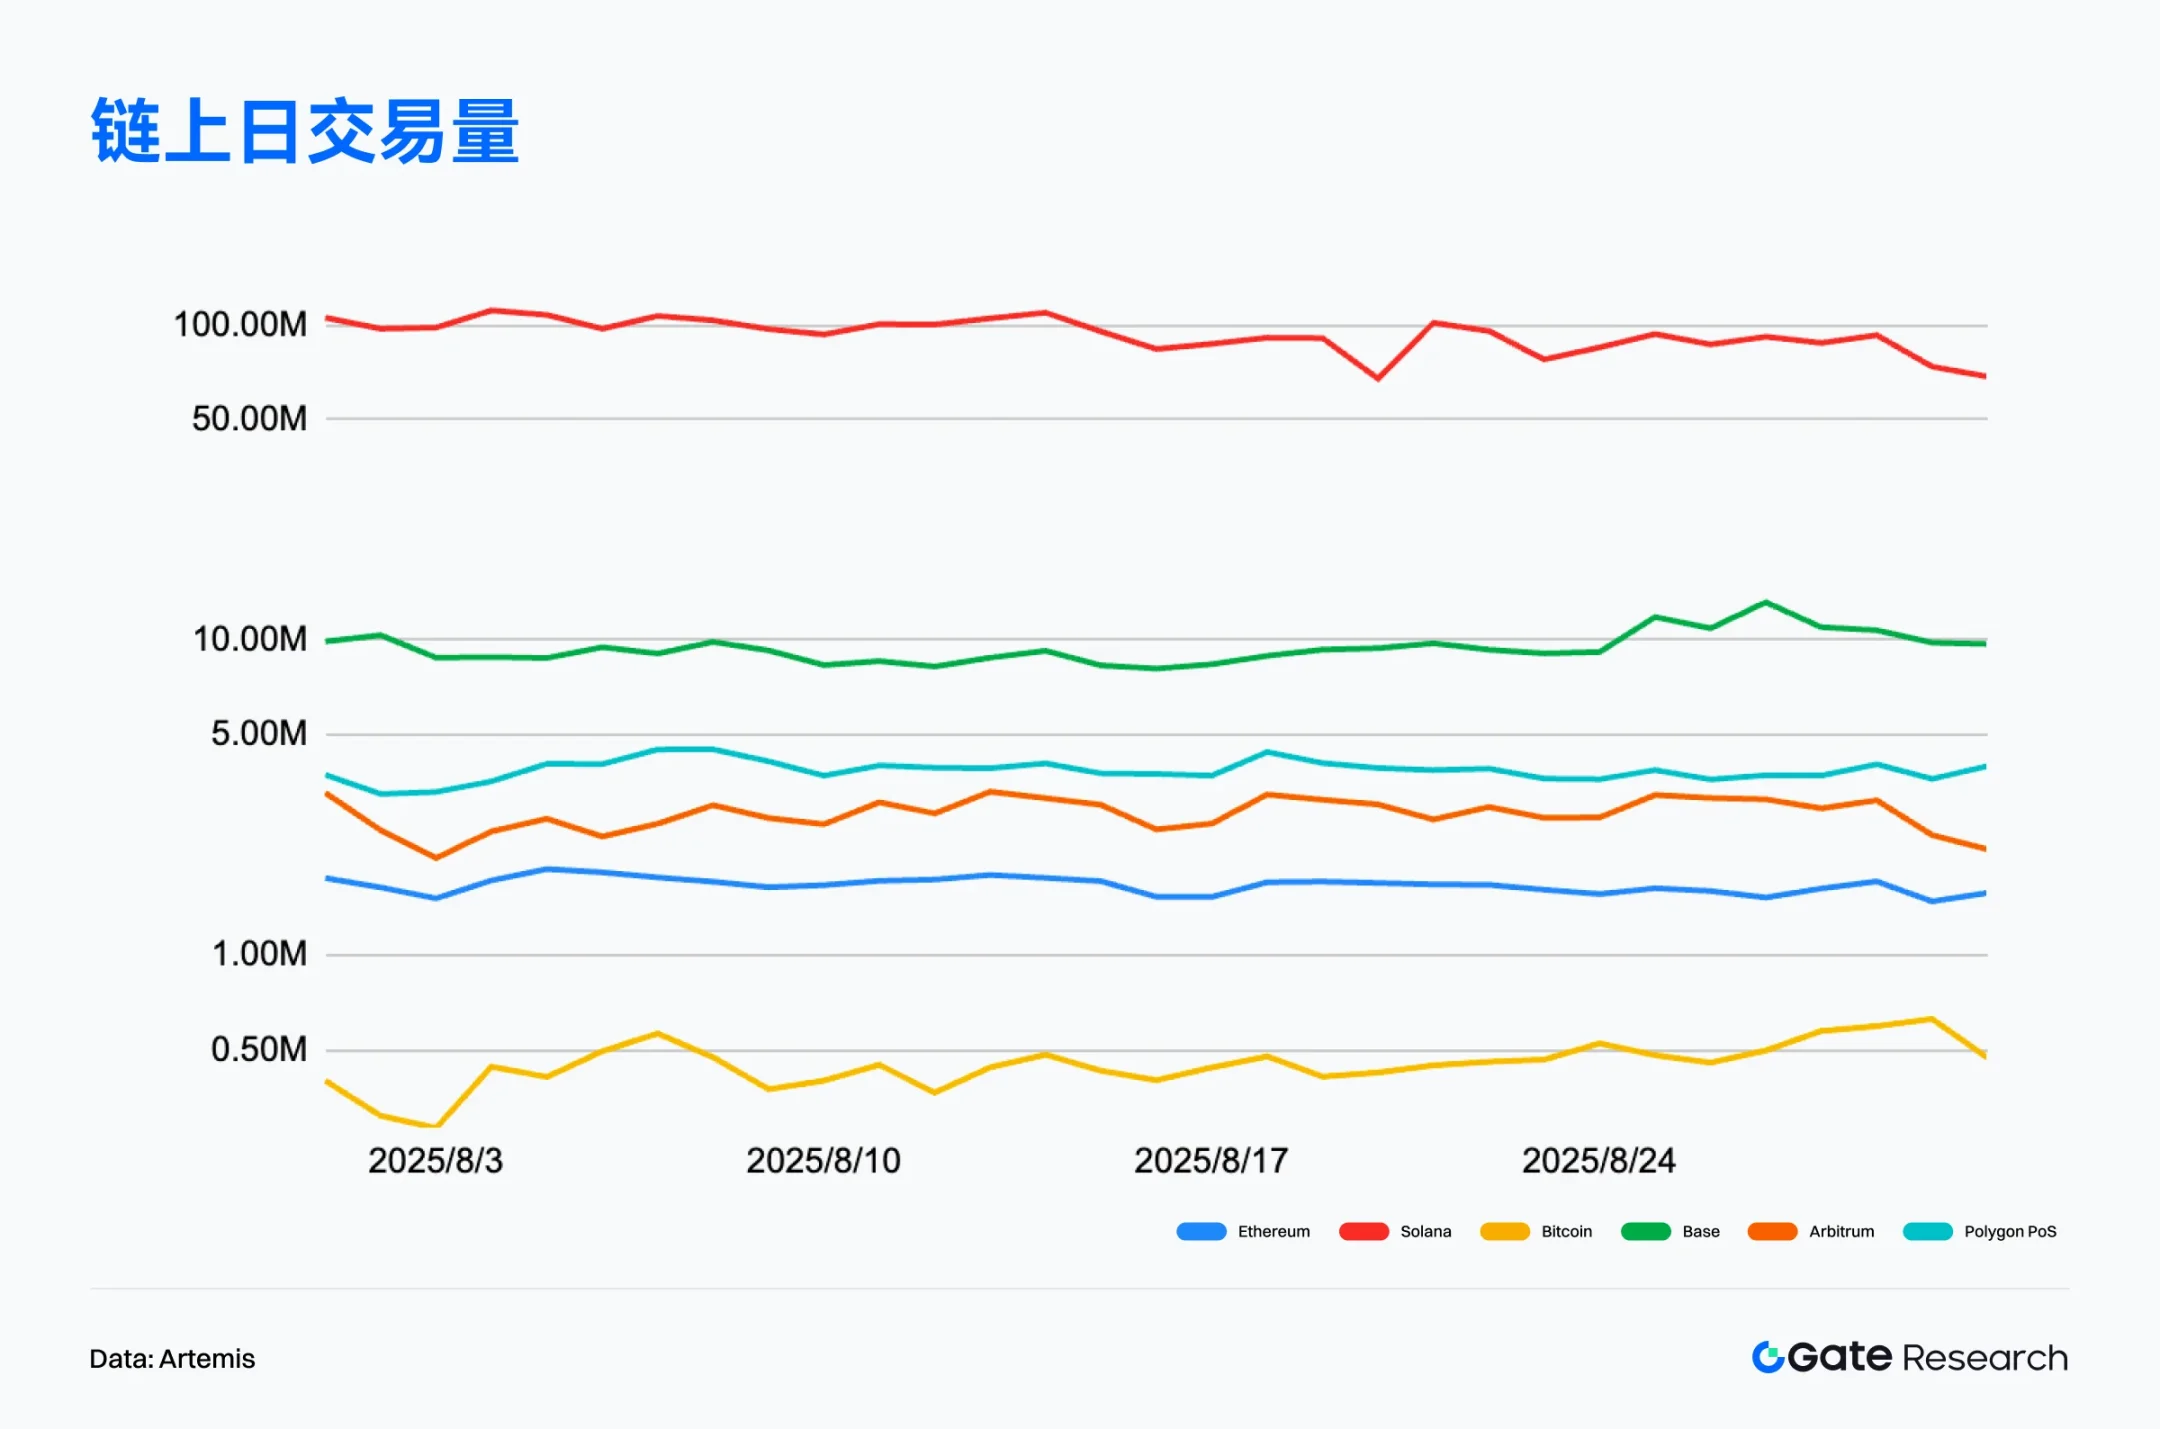
According to Artemis data, as of August 31, 2025, Solana continued to rank first among mainstream public chains with a monthly transaction volume of over 29 billion transactions, and its average daily transaction volume remained stable between 90 million and 100 million transactions, demonstrating strong on-chain interaction stickiness and high-frequency application structure. Although there were slight fluctuations at the end of the month, the overall activity still far exceeded that of other public chains, reflecting the advantages of its ecological vitality and efficient architecture. [1]
Ethereum's on-chain transaction volume reached a new high for two consecutive months, exceeding 51.77 million transactions, a nearly four-year high. This reflects the continued strong activity of the mainnet despite the diversion of Layer 2. Although the high value of individual transactions and gas costs remain limiting factors, the overall transaction structure is robust, and the linkage effect between the mainnet and Layer 2 continues to strengthen.
In addition, according to DefiLlama data, the monthly trading volume of DEX on the Ethereum chain reached US$140.1 billion in August 2025, setting a new record; the current TVL is US$92.58 billion, still about 17% lower than the 2021 peak. The simultaneous increase in trading volume and user activity indicates a significant improvement in capital utilization. User behavior is shifting from static lock-up to more frequent trading and liquidity utilization, showing a trend structure of "trading activity outperforming TVL recovery." [2]
Overall, Solana maintains its strong performance, characterized by high-frequency interactions and a highly sticky structure, and continues to dominate the on-chain trading landscape. Base has steadily established itself as a dominant player in Layer 2 transactions. Ethereum, with its mainnet continuing to reach new heights and its Layer 2 development progressing in tandem, demonstrates the resilience and value-carrying capacity of a classic public chain. The on-chain trading ecosystem is accelerating its structural differentiation into "high-frequency, affordable chains" and "low-frequency, high-net-worth chains."
Active Address Analysis: Solana Leads, Ethereum Reaches New High
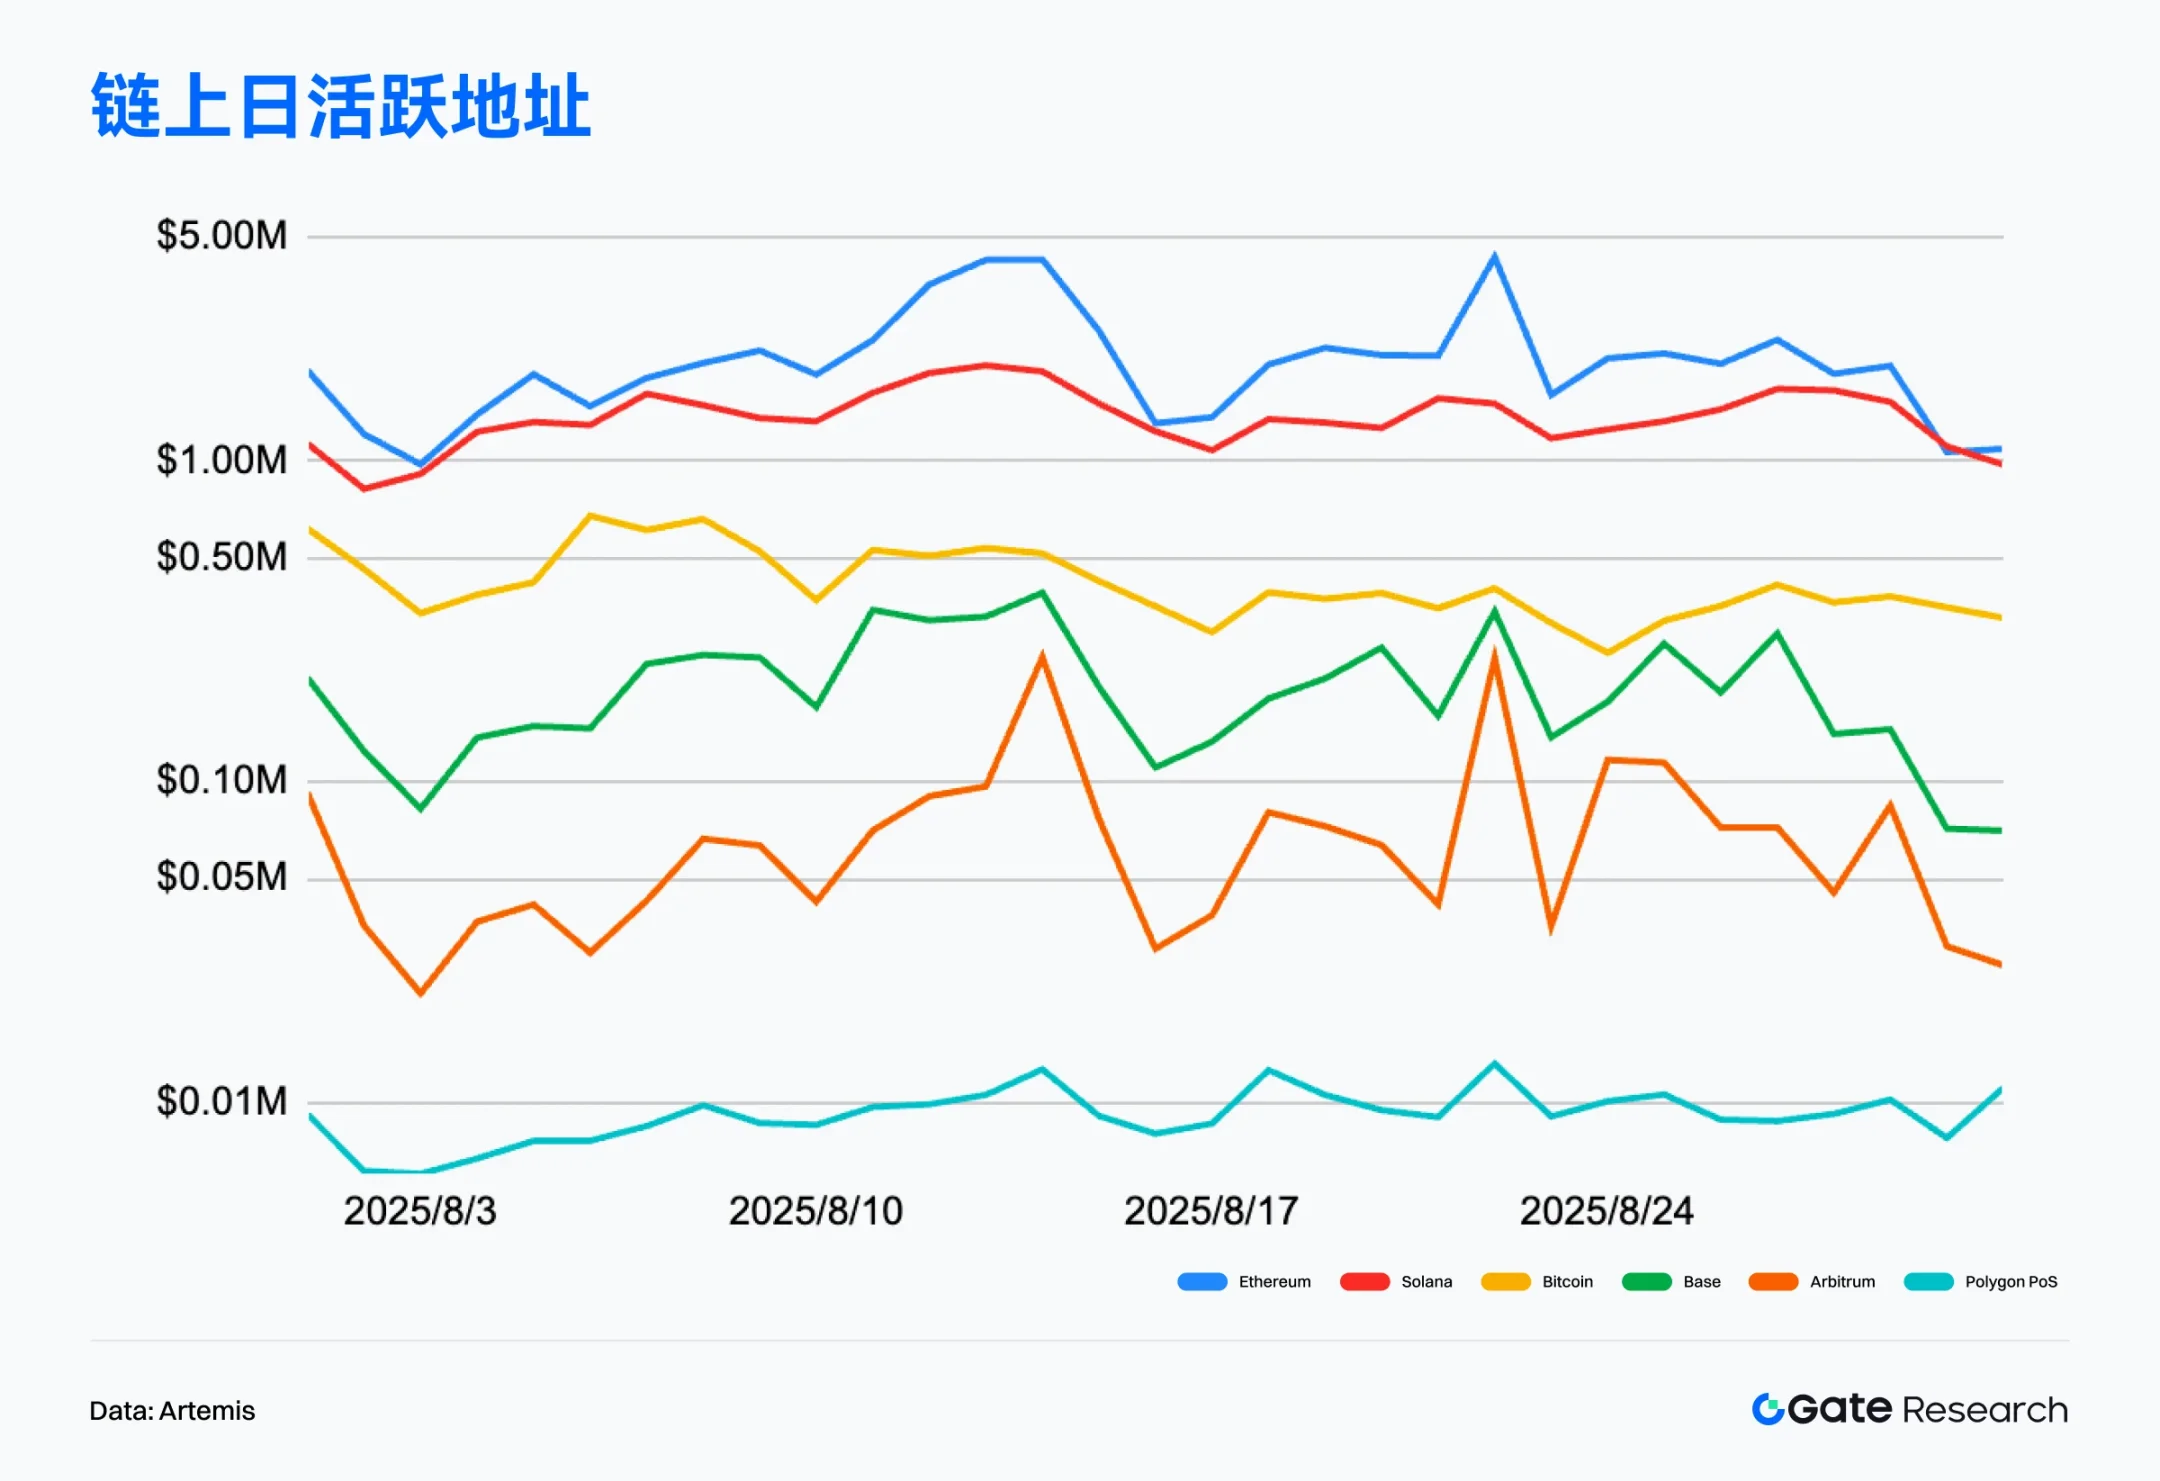
According to Artemis data, as of August 31, 2025, the average daily active addresses on the Ethereum mainnet were approximately 543,000, with a steady upward trend. The total number of monthly active addresses exceeded 16 million, setting a new historical high, indicating that its user base is steadily expanding. [3]
Solana still maintains an absolute lead in terms of active addresses, with an average of 3.587 million daily addresses, demonstrating extremely strong user stickiness and high-frequency usage scenarios; Base ranks second with 1.206 million, reflecting its significant results in native ecosystem construction and application traffic diversion.
Overall, Solana maintains a commanding lead in active addresses, while Base's rapid rise demonstrates its latecomer advantage. Ethereum, with its composite "mainnet + L2" structure, forms a more complete ecosystem. The on-chain user structure has clearly differentiated into a "high-frequency user chain" and a "value-carrying chain," further clarifying its ecosystem positioning.
On-chain fee income analysis: Ethereum continues to dominate high-value scenarios, while Solana performs strongly
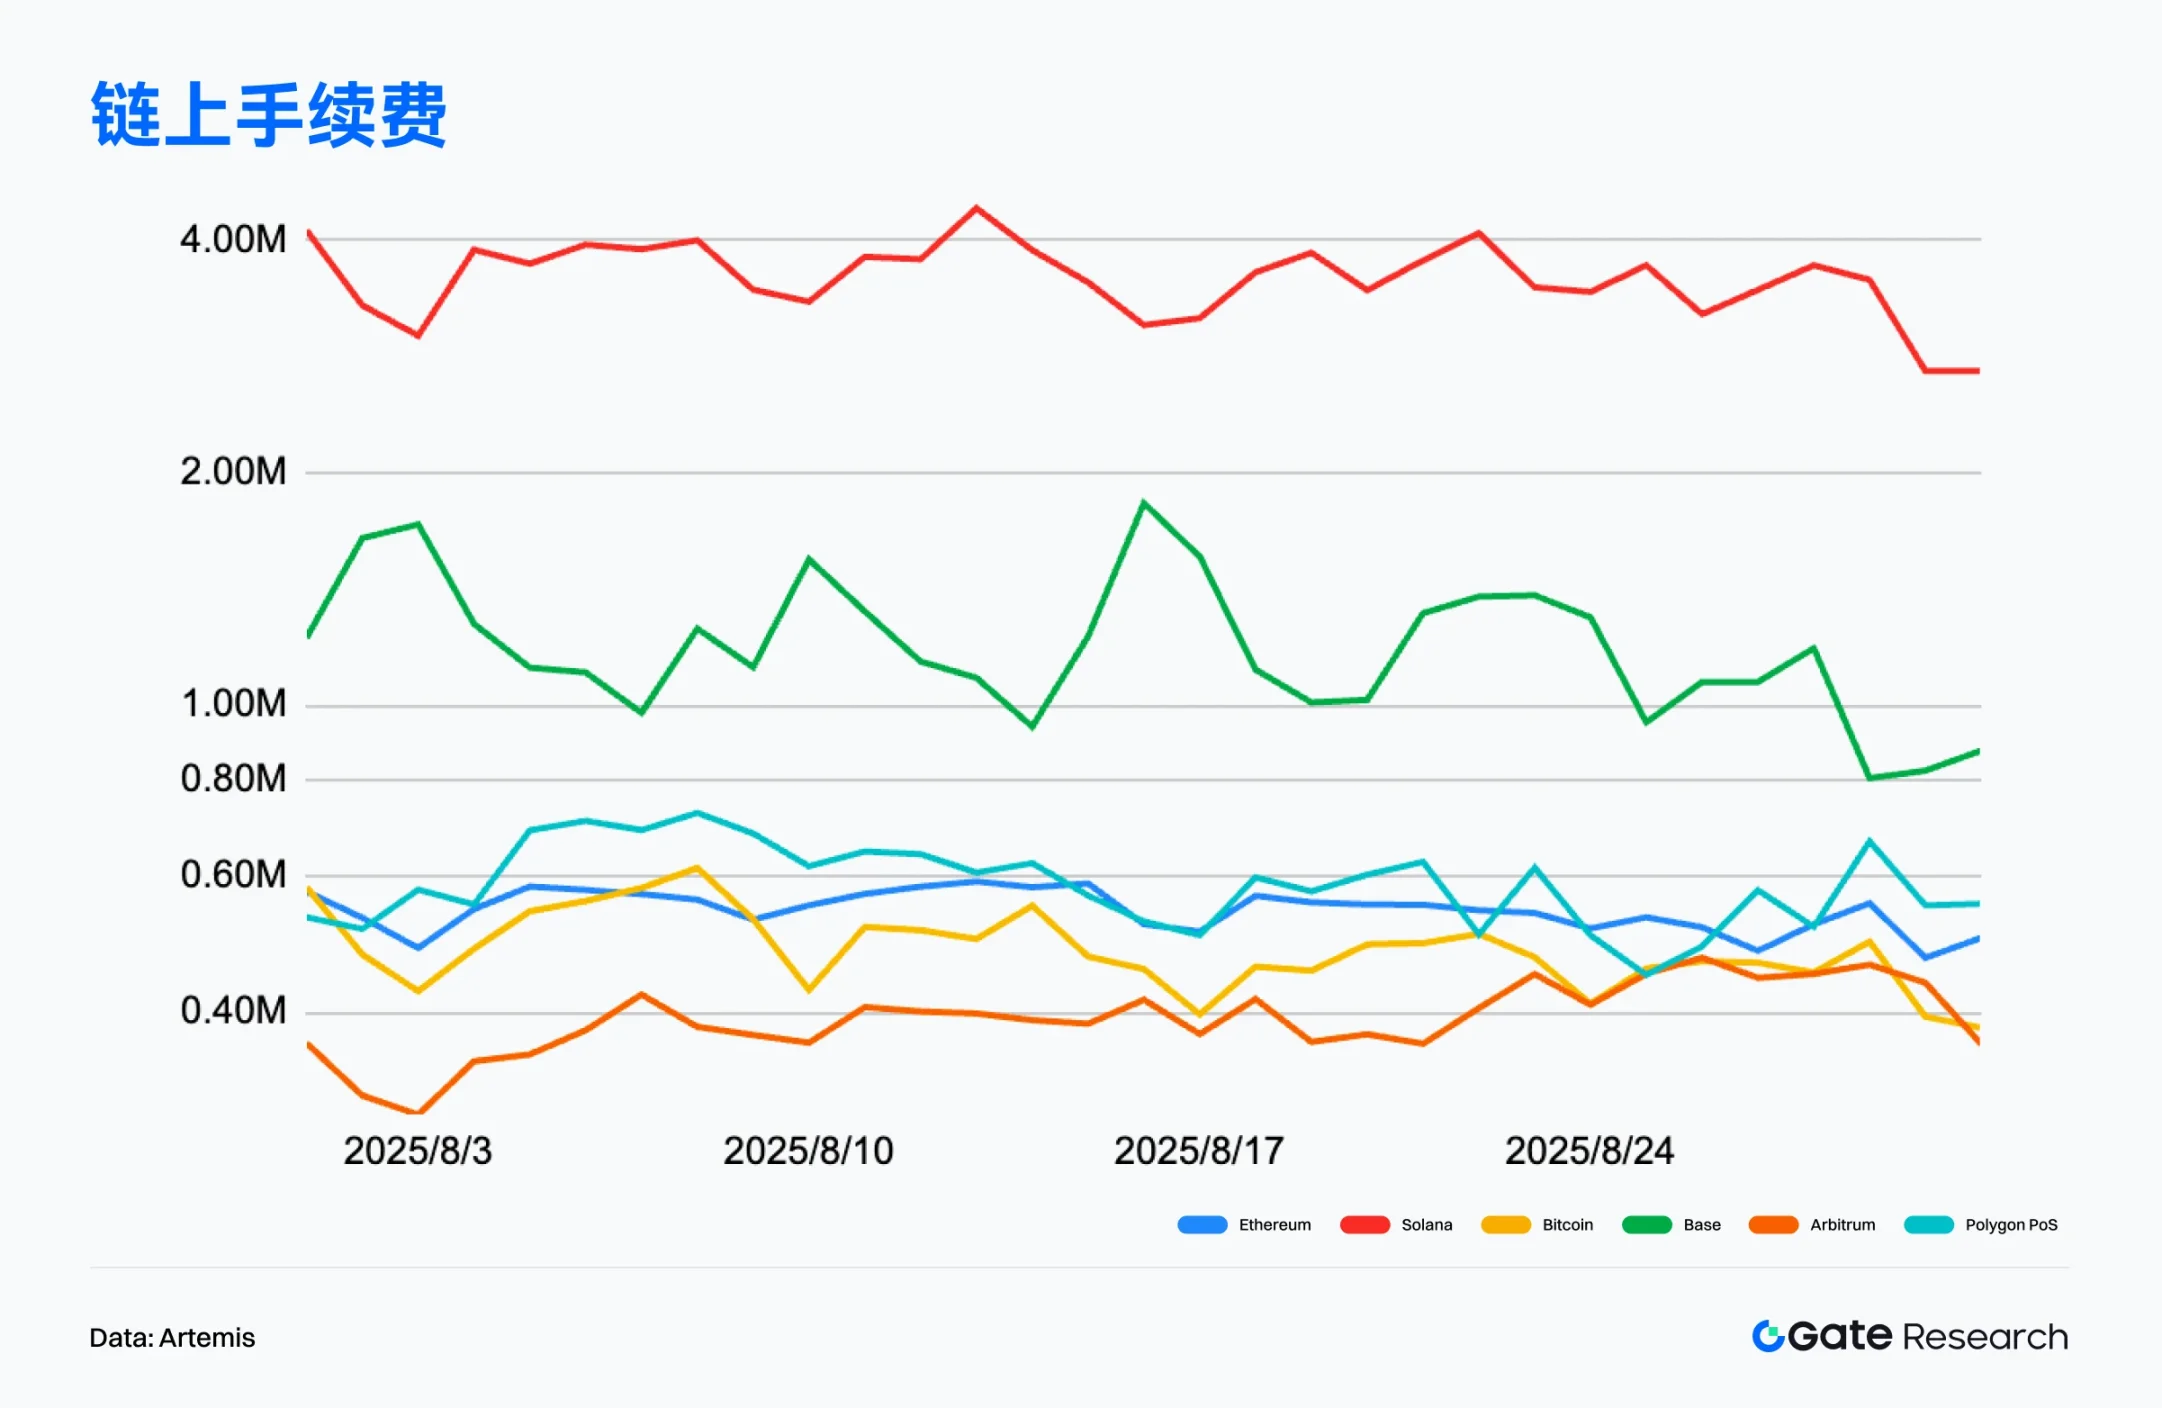
According to Artemis data, as of August 31, 2025, Ethereum's on-chain transaction fee revenue totaled approximately US$65 million. Although it has declined slightly from the previous month, it is still far ahead of other public chains. There was a single-day peak of nearly US$5 million in the middle of the month, indicating that the main network transaction enthusiasm remains high due to the active DEX and the deployment of new projects. Although the Layer 2 network bears a large amount of daily transaction traffic, the high-value interaction demand of the Ethereum main network still constitutes the main support for its transaction fee income. [4]
Solana demonstrated remarkable stability, with stable monthly fee trends and daily revenue consistently maintaining between $1 million and $1.5 million. Its overall performance was second only to Ethereum, placing it firmly in second place. Solana's high-frequency, micro-transaction mechanism ensures extremely low unit fees, yet its massive transaction volume still supports substantial revenue, highlighting the maturing commercialization foundation of Solana in high-frequency scenarios.
Overall, Ethereum maintains a firm lead in on-chain fee revenue, while Solana maintains stable performance and high-frequency growth, while Base is steadily rising thanks to its native ecosystem. The increasingly pronounced divergence in fee revenue reflects the different positioning and development paths of each chain, focusing on value-based interactions versus frequency-based interactions.
Analysis of public chain capital flows: Ethereum leads the pack, while Polygon sees the most significant capital outflow
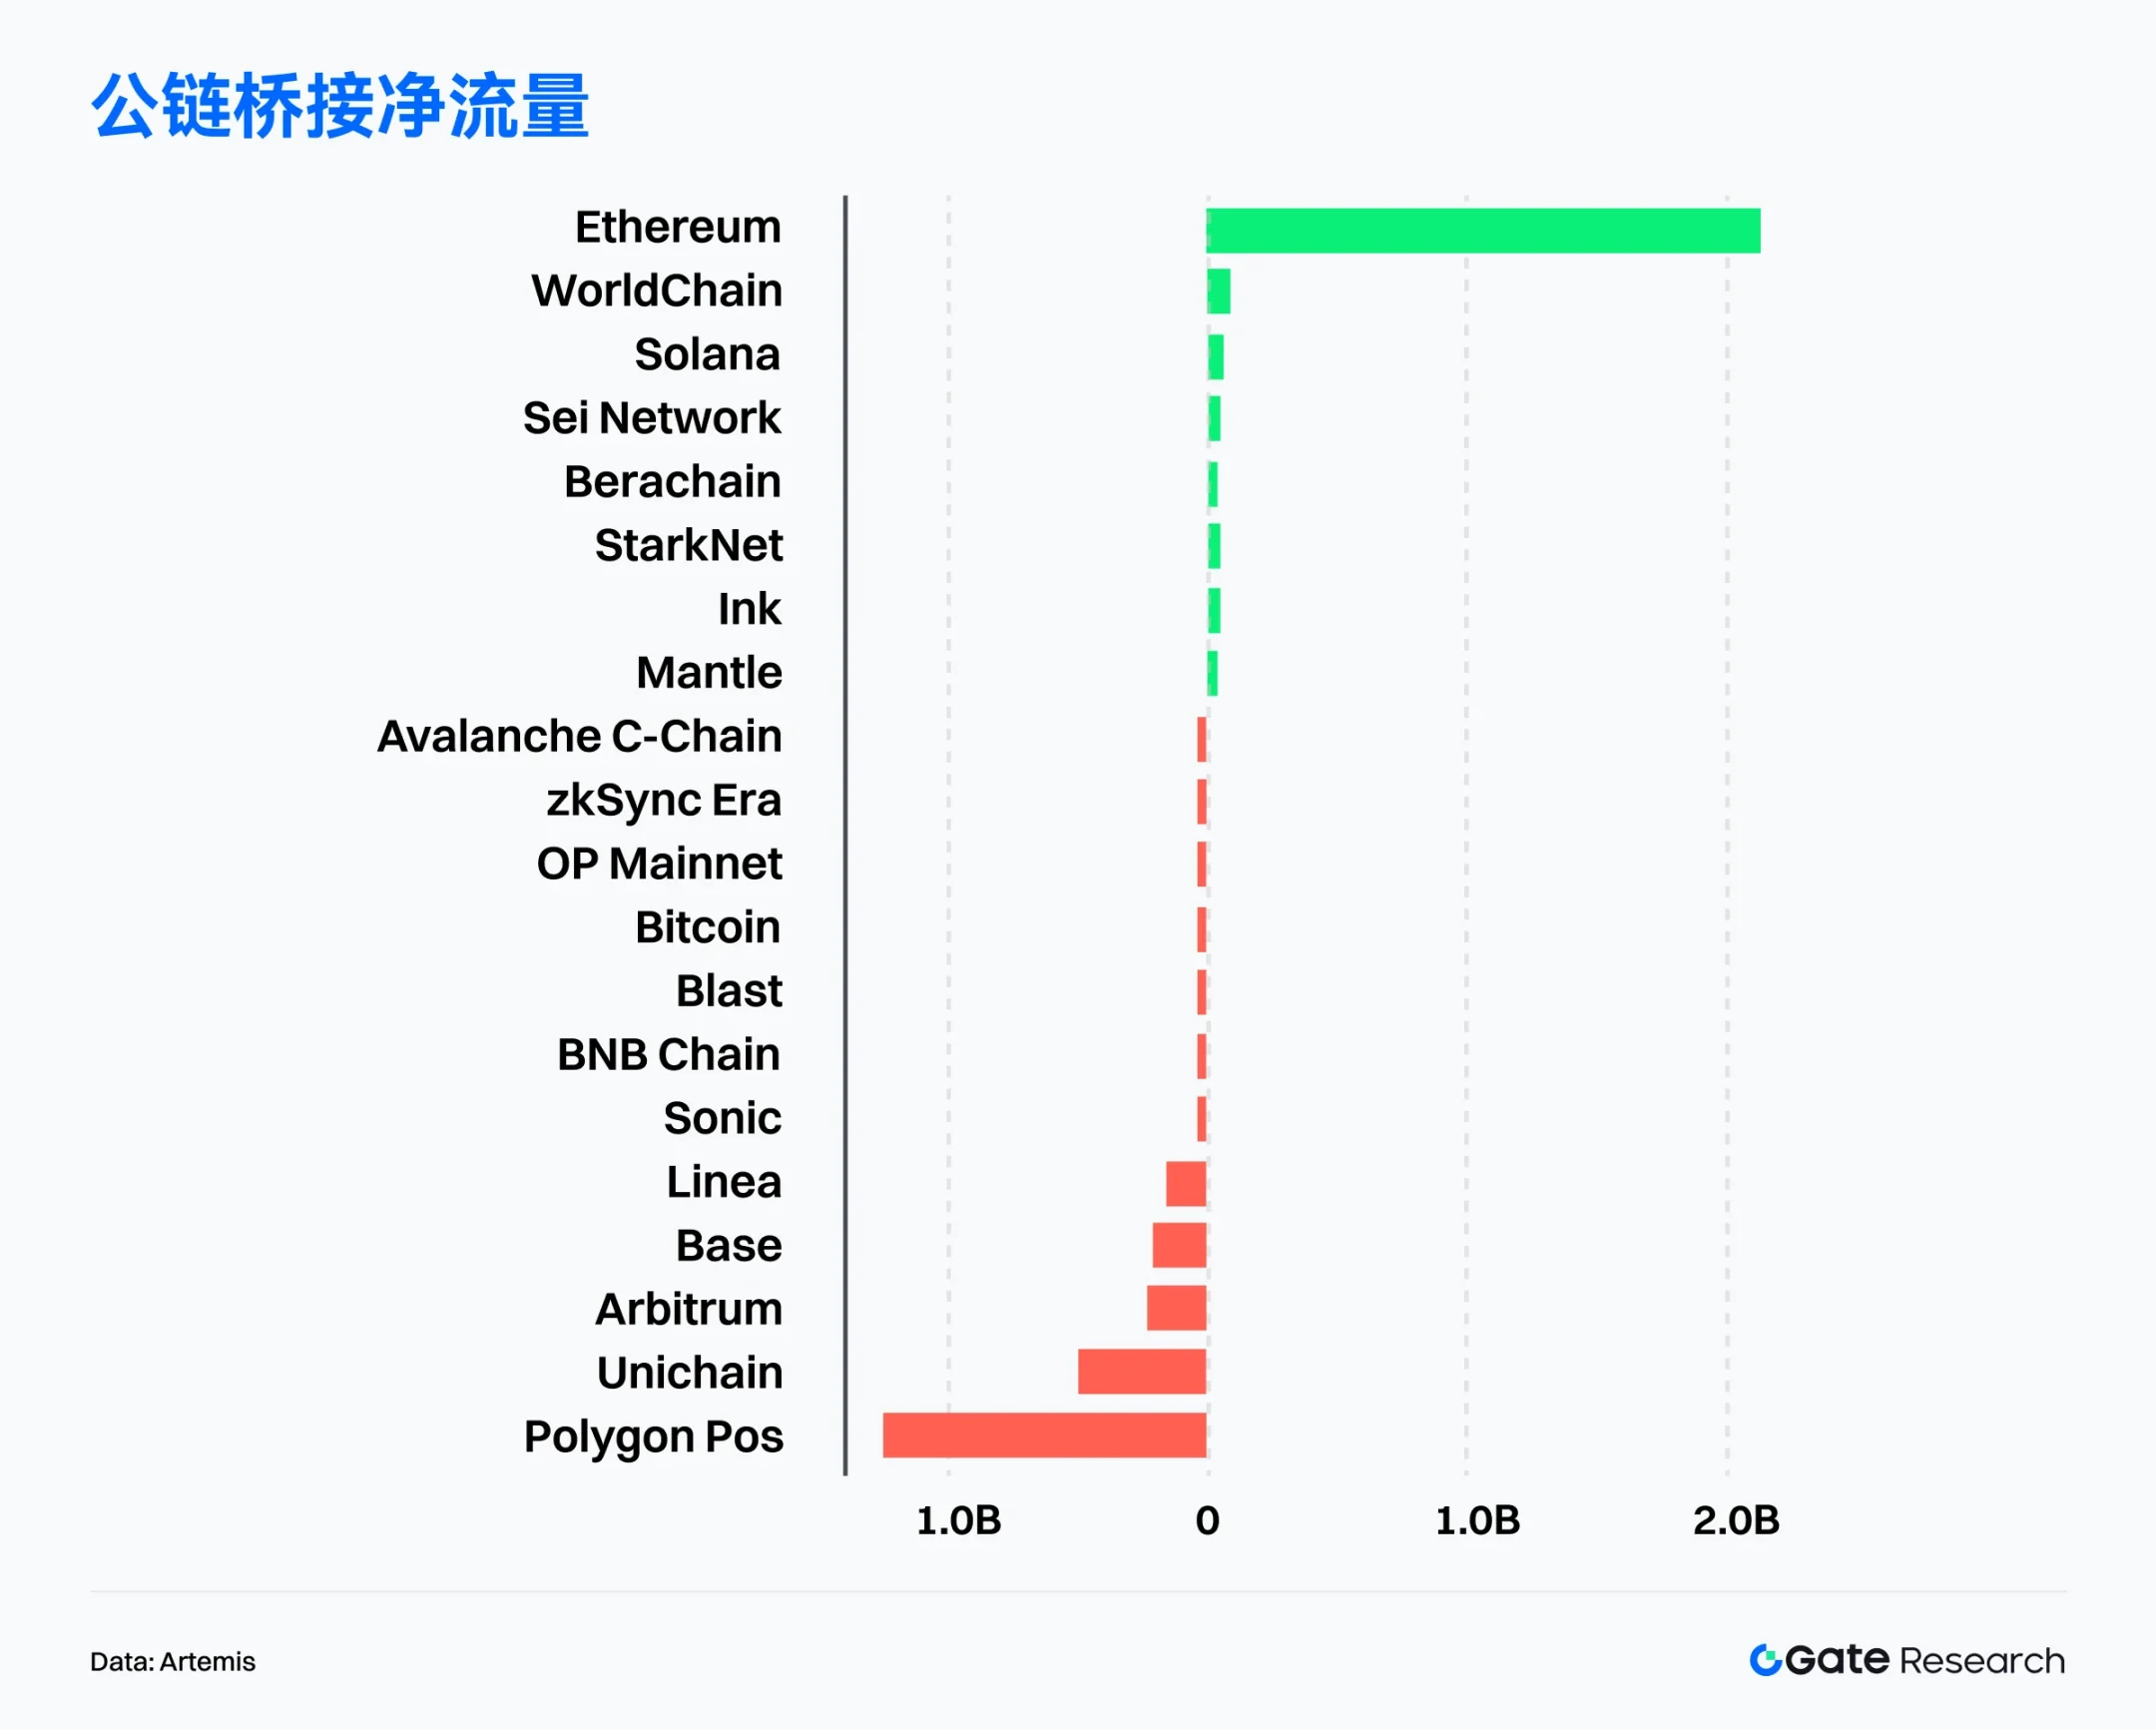
According to Artemis data, Ethereum recorded a net inflow of over $2 billion, continuing to rank first in public chain capital flows, demonstrating its overwhelming advantage in institutional allocation and ecological depth. [5] Driven by the Fed's "dovish" signal and institutional buying, the price of ETH broke through a record high of $4,956, with a market capitalization exceeding $580 billion, ETF management scale exceeding $30.5 billion, and a net inflow of nearly $2.8 billion in a single month. Institutional holdings also increased. BitMine acquired 690,000 ETH in one month, accounting for nearly 1% of the global supply, becoming the largest public holding company, further highlighting the dual value of ETH's "capital appreciation + cash flow". [6]
At the same time, on-chain applications continue to expand. Robinhood and Ondo Finance are promoting the implementation of stock and stock token transactions. The monthly transfer amount of USDC has reached 748.3 billion US dollars. The TVL of the DeFi protocol Pendle has also exceeded 10 billion US dollars, indicating that Ethereum's core position in compliant finance and DeFi infrastructure continues to consolidate. [7]
In addition to Ethereum, WorldChain and Solana also recorded net inflows of $98.8 million and $72.7 million, respectively, demonstrating the attractiveness of both emerging and established public chains. In contrast, several mainstream public chains experienced significant outflows. Polygon PoS saw a net outflow of over $1 billion in a single month, while Unichain and Arbitrum also saw net outflows of $490 million and $230 million, respectively. Base also saw an outflow of $190 million, reflecting a market rebalancing of valuations and interest in some L2 and sidechains.
Overall, the pattern of capital flows tends to be "the strong get stronger", and Ethereum's leading position in capital acceptance, institutional deployment and ecosystem construction has been further amplified. Emerging public chains such as WorldChain and Solana continue to attract funds by leveraging the ecological superposition effect; while some early popular L2 and side chains are facing pressure from capital withdrawal, and market hotspot switching and liquidity games are becoming more frequent.
Bitcoin key indicator analysis
After Bitcoin reached an all-time high of $124,000 in August, its upward momentum has slowed significantly, with prices entering a period of high volatility and periodic corrections. As a core market anchor, its on-chain structural indicators are also releasing multiple signals, revealing a profound adjustment in capital flow and market structure. As capital inflows slow and demand momentum weakens, on-chain supply distribution and investor holdings are becoming key indicators for predicting future trends.
To more systematically assess the support logic and risk evolution of the current high range, this article will focus on three core on-chain indicators: capital inflows and outflows and realized market capitalization (Realized Cap & Net Position Change), profit-taking pressure and market absorptive capacity (Volatility Adjusted Realized Profit/Loss), and cost basis and risk tolerance (Cost Basis Distribution & Relative Unrealized Loss). Through these cross-sectional observations, we can more clearly depict the market's high-level chip distribution, capital absorption capacity, and potential risks, providing a forward-looking on-chain perspective for analyzing subsequent market trends.
BTC capital inflow slows down, and high-level demand momentum is insufficient
According to Glassnode data, after Bitcoin broke through the historical high of $124,000, although the realized market value continued to rise, the capital inflow rate slowed down significantly. Compared with the situation when it broke through the historical high in March and December 2024, the net capital inflow expanded significantly, while the peak of green capital inflow in this round was far lower than the previous level. This shows that even though the price hit a new high, there was no significant influx of new funds into the market, and investors' willingness to enter the market at high levels has obviously weakened. Overall, it reflects the lack of momentum on the demand side and relatively weak support from the capital side. [8]
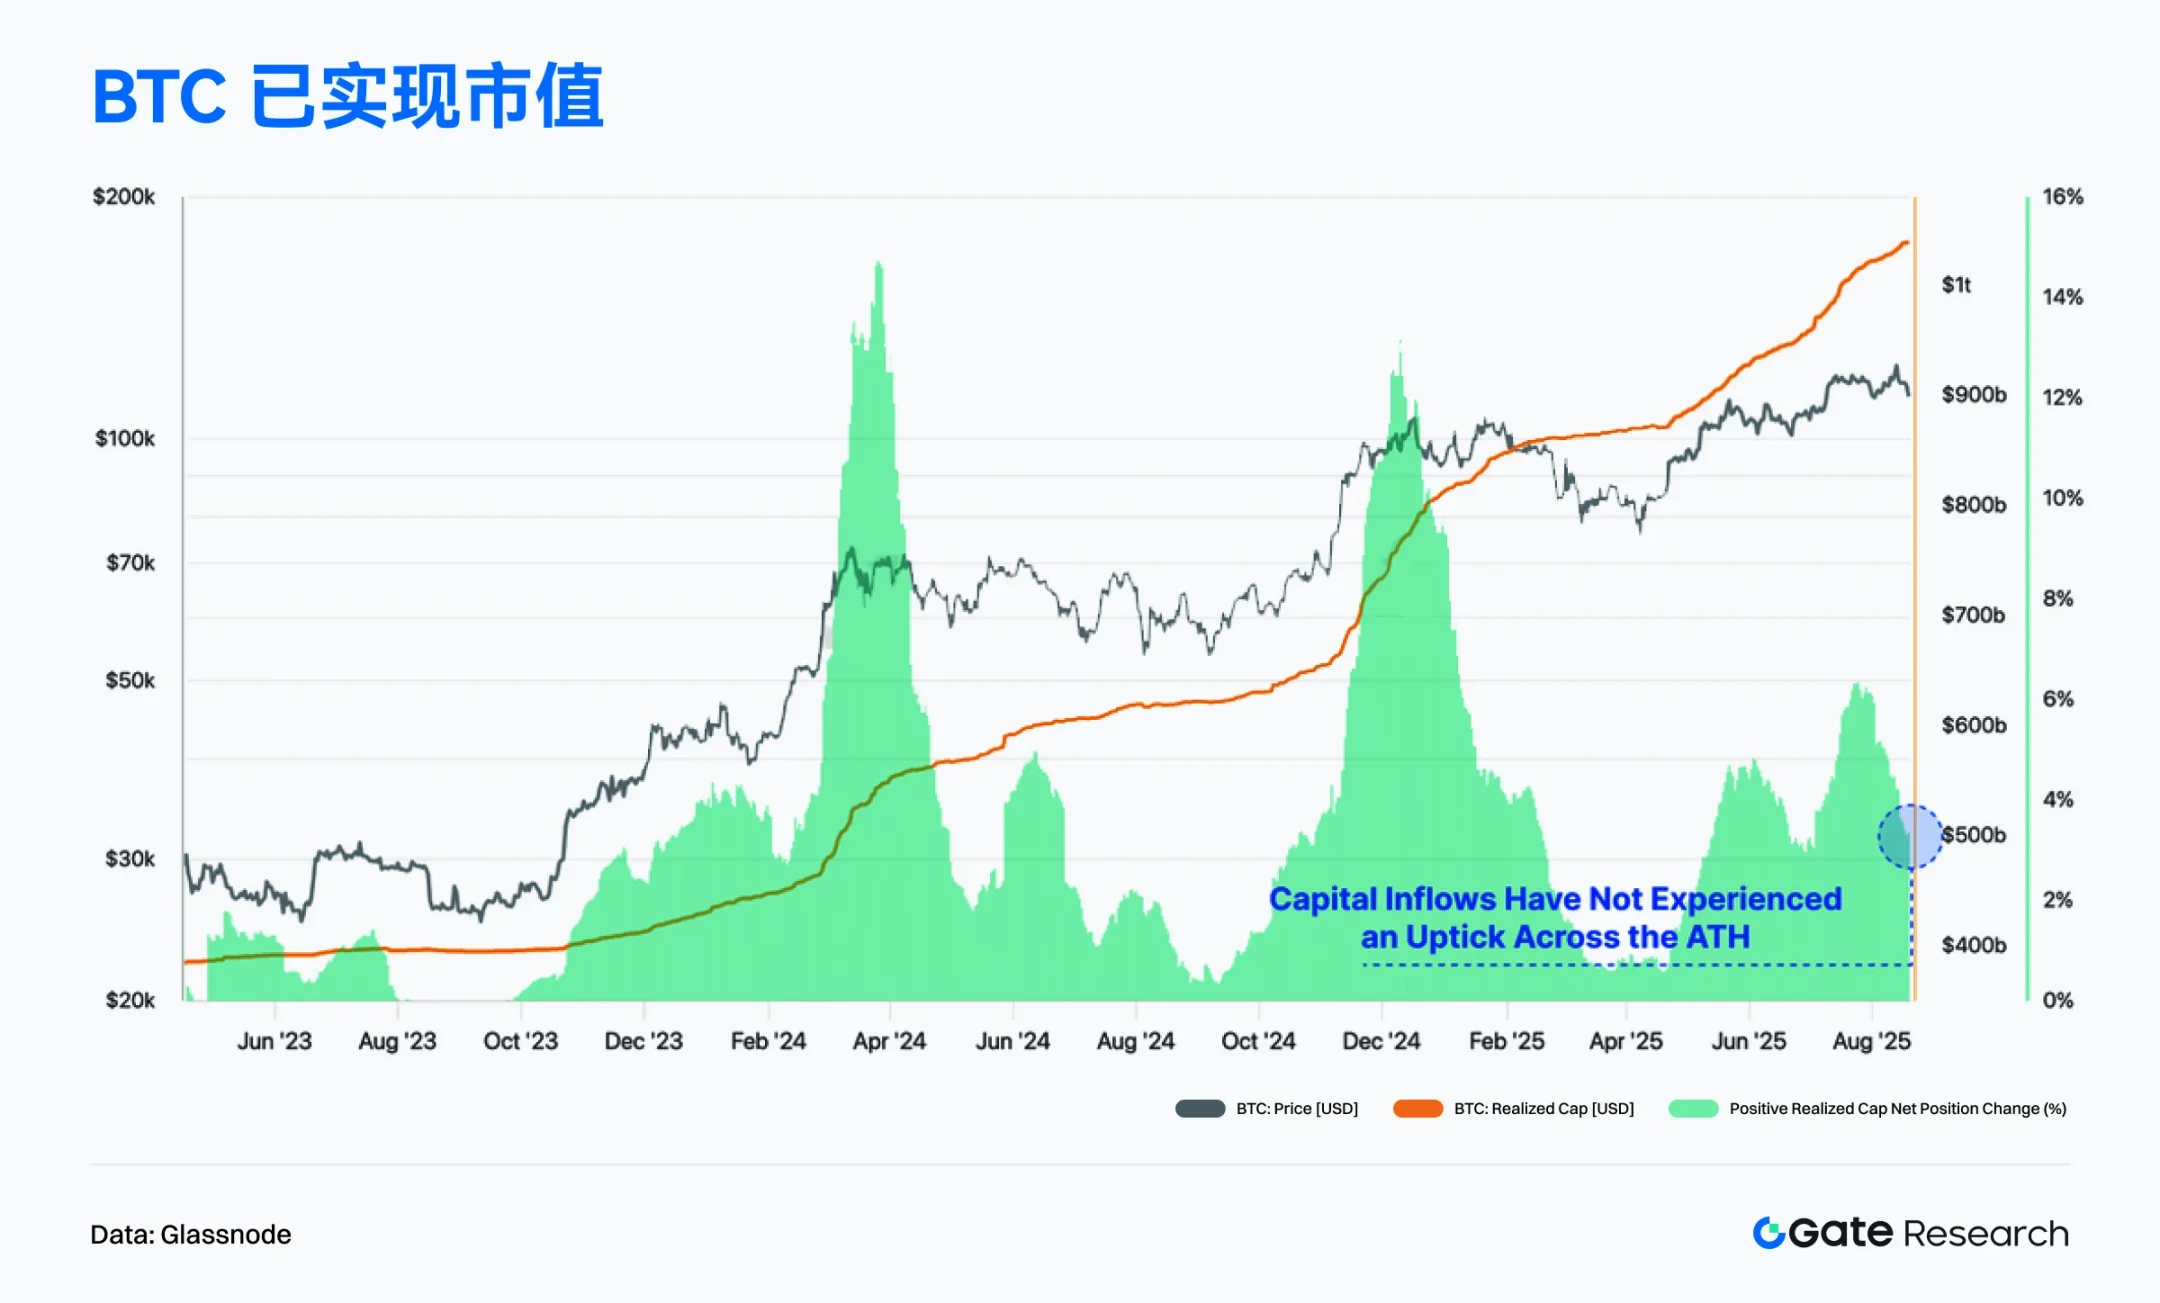
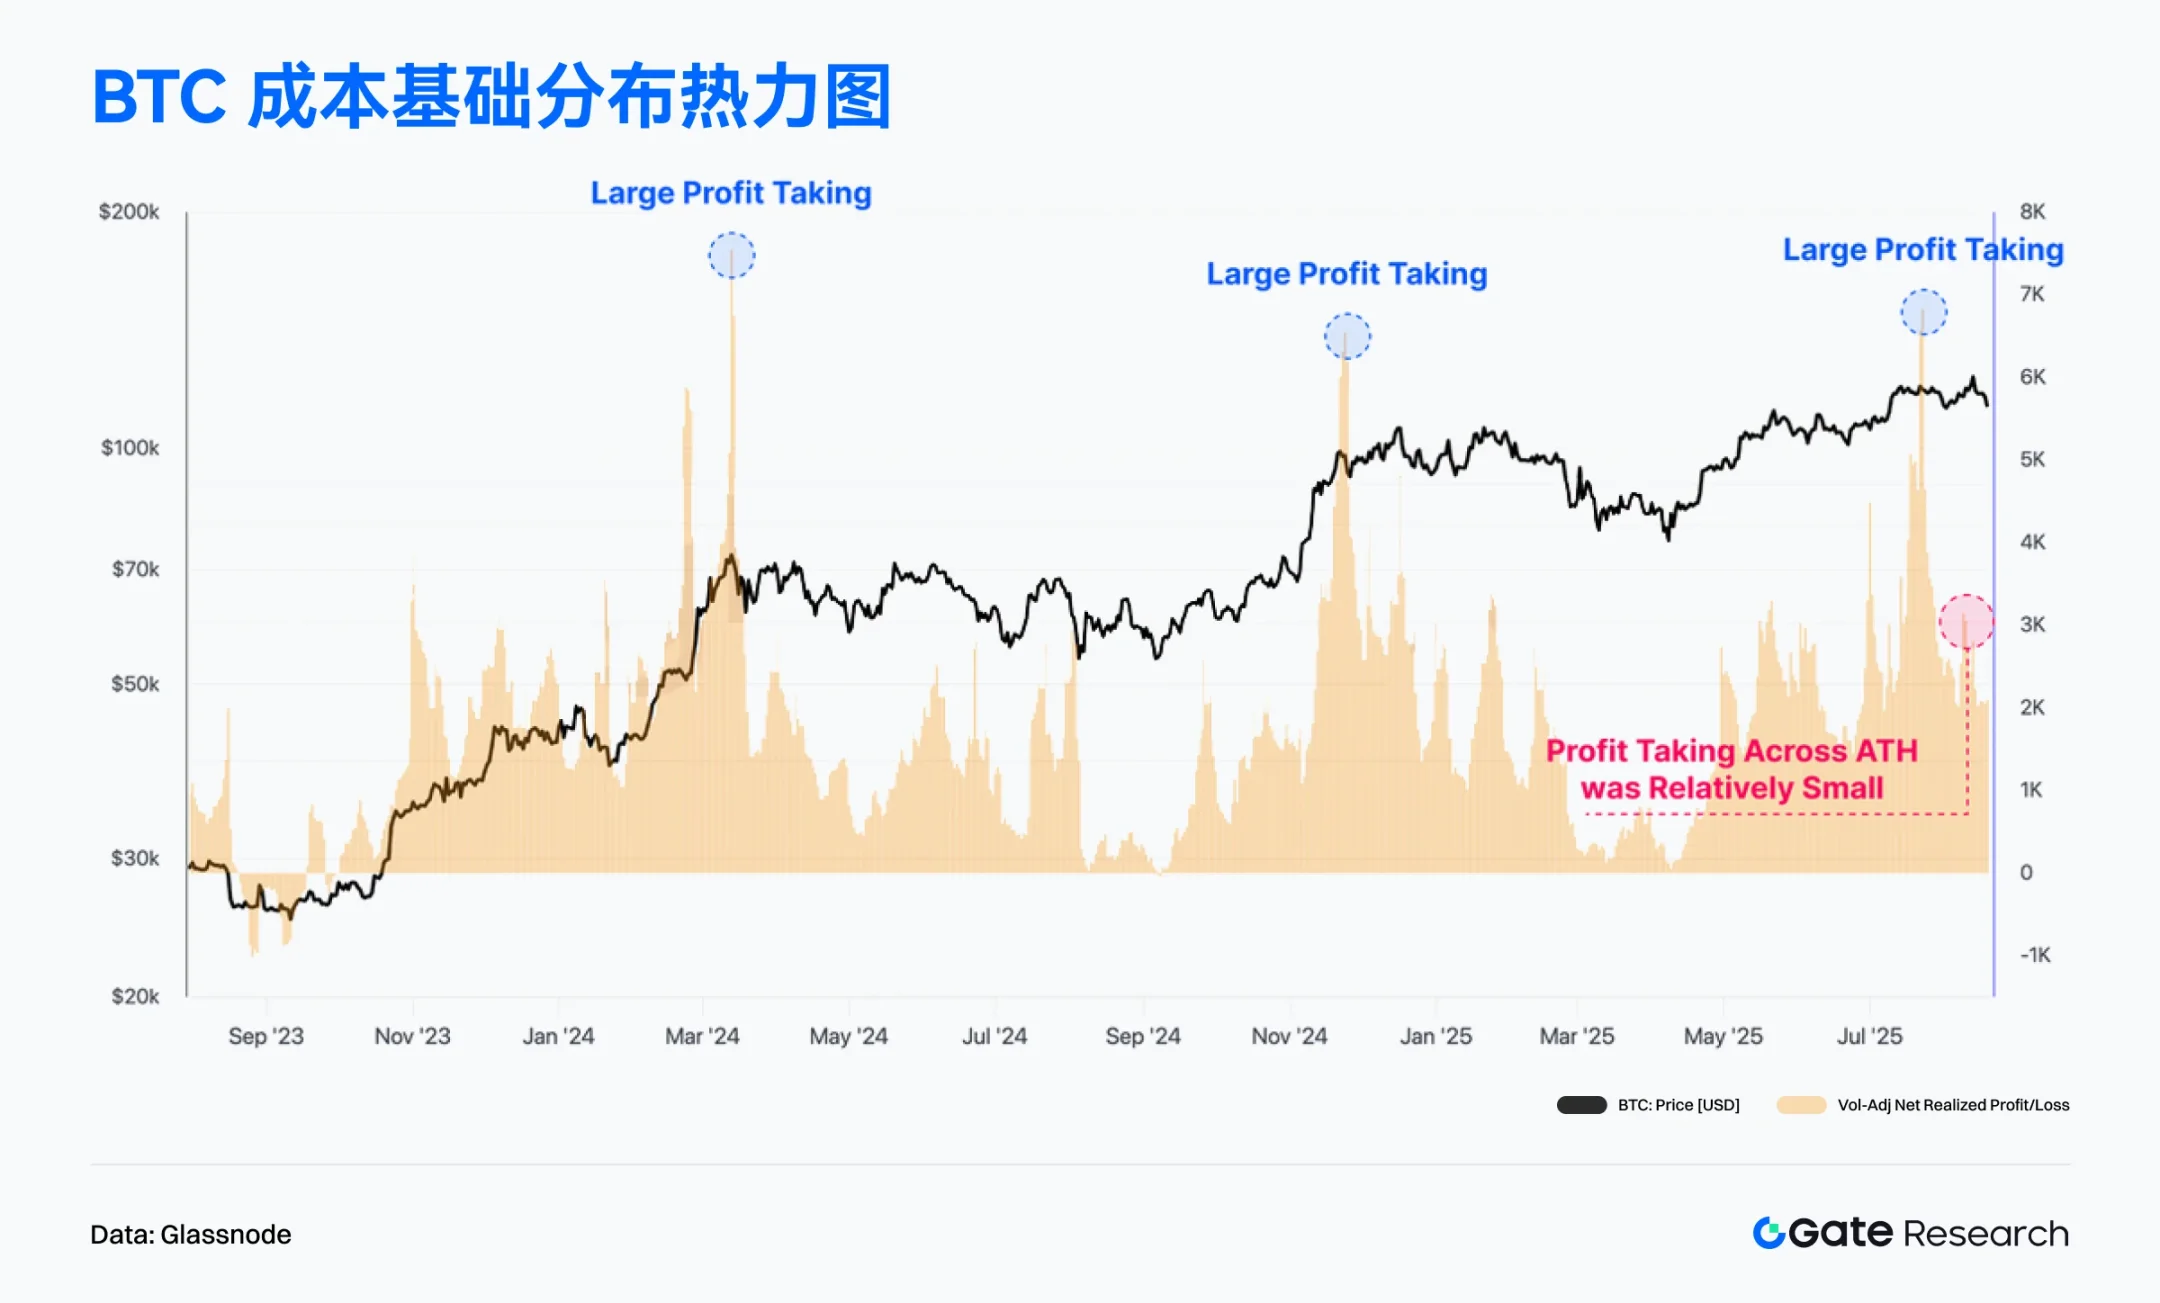
At the same time, the Volatility Adjusted Net Realized Profit/Loss (7d) shows that every time Bitcoin breaks through its all-time high (ATH), it is often accompanied by a significant wave of profit-taking. However, during the breakthrough of the new high of $124,000 in August 2025, the scale of profit-taking in the market was relatively mild, with only limited capital outflows, and did not reach the extreme levels of the previous two ATHs. [9]
This suggests that investors are currently more inclined to hold rather than rush to cash out, resulting in less selling pressure and a more robust market structure. Overall, while insufficient short-term capital inflows are limiting further upside, low profit-taking pressure is helping to maintain market consolidation at high levels, rather than a rapid, deep correction.
BTC's cost base is accumulating, and key support areas are gradually consolidating.
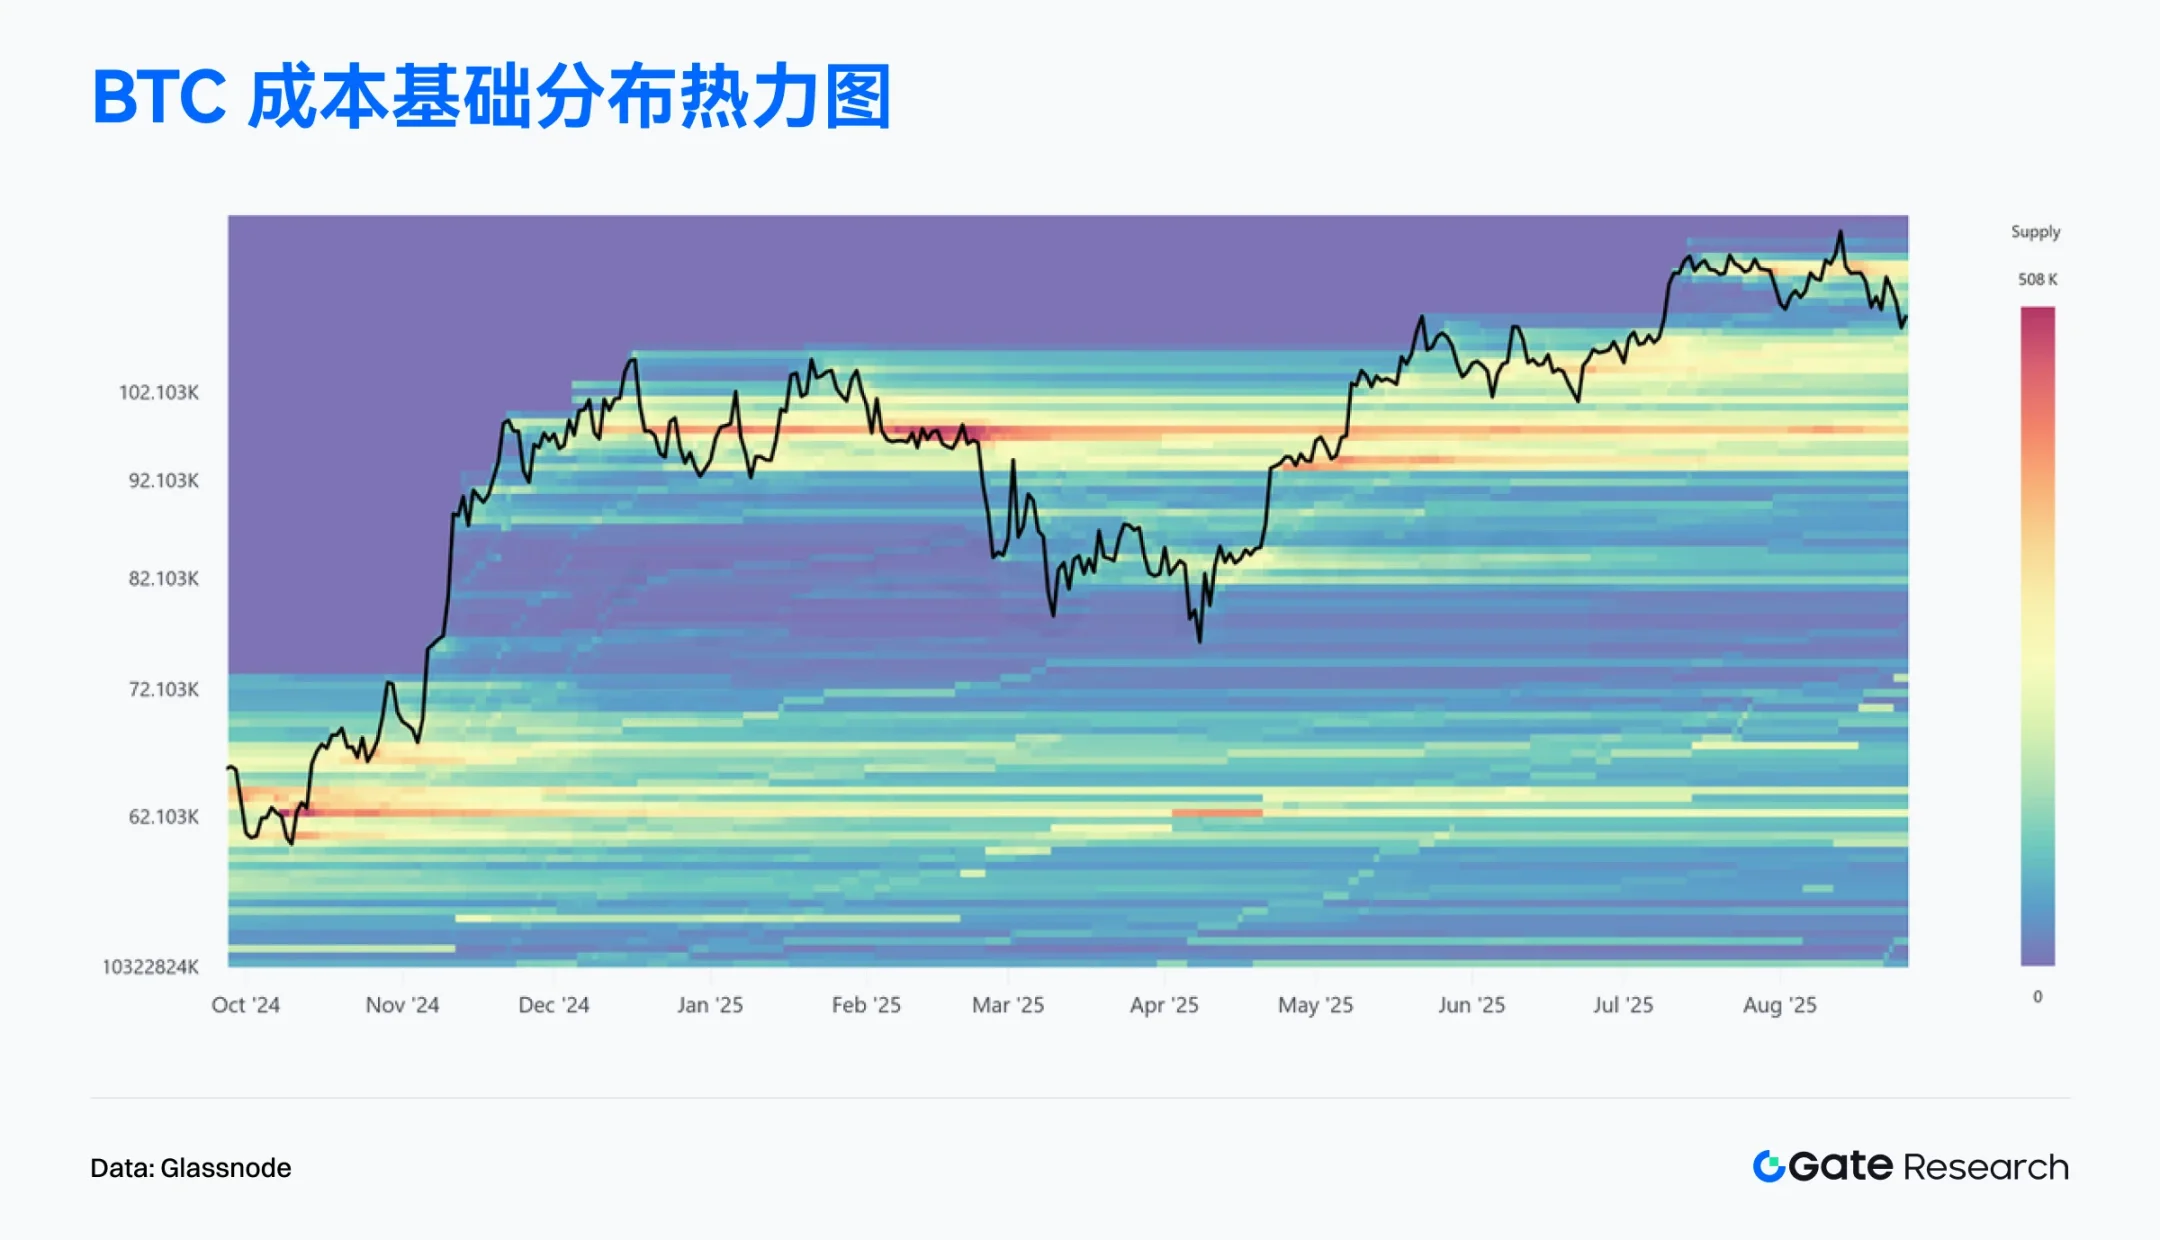
According to Glassnode data, the heat map of BTC's cost basis distribution shows that a clear supply-intensive zone has formed in the $93,000–110,000 range, which has continued to accumulate since December 2024 and has gradually become an important support area for the current market. Although the price has recently fallen from the high of $124,000, it is still running above this supply zone, showing strong carrying capacity. [10]
Meanwhile, the range above $110,000 is relatively sparsely supplied, forming a so-called "white space." This area lacks stable support or resistance, leading to higher volatility. Currently hovering around $111,000, a further correction could be supported by the solid underlying cost base. A sustained hold would indicate a sustained accumulation of funds within this range, laying the foundation for a subsequent rebound. Overall, this heat map highlights the supply concentration and potential bottoming effect of BTC in the $93,000–110,000 range, while also revealing the market's current position on the brink of critical support.
BTC's unrealized losses remain low, and the market pressure is limited
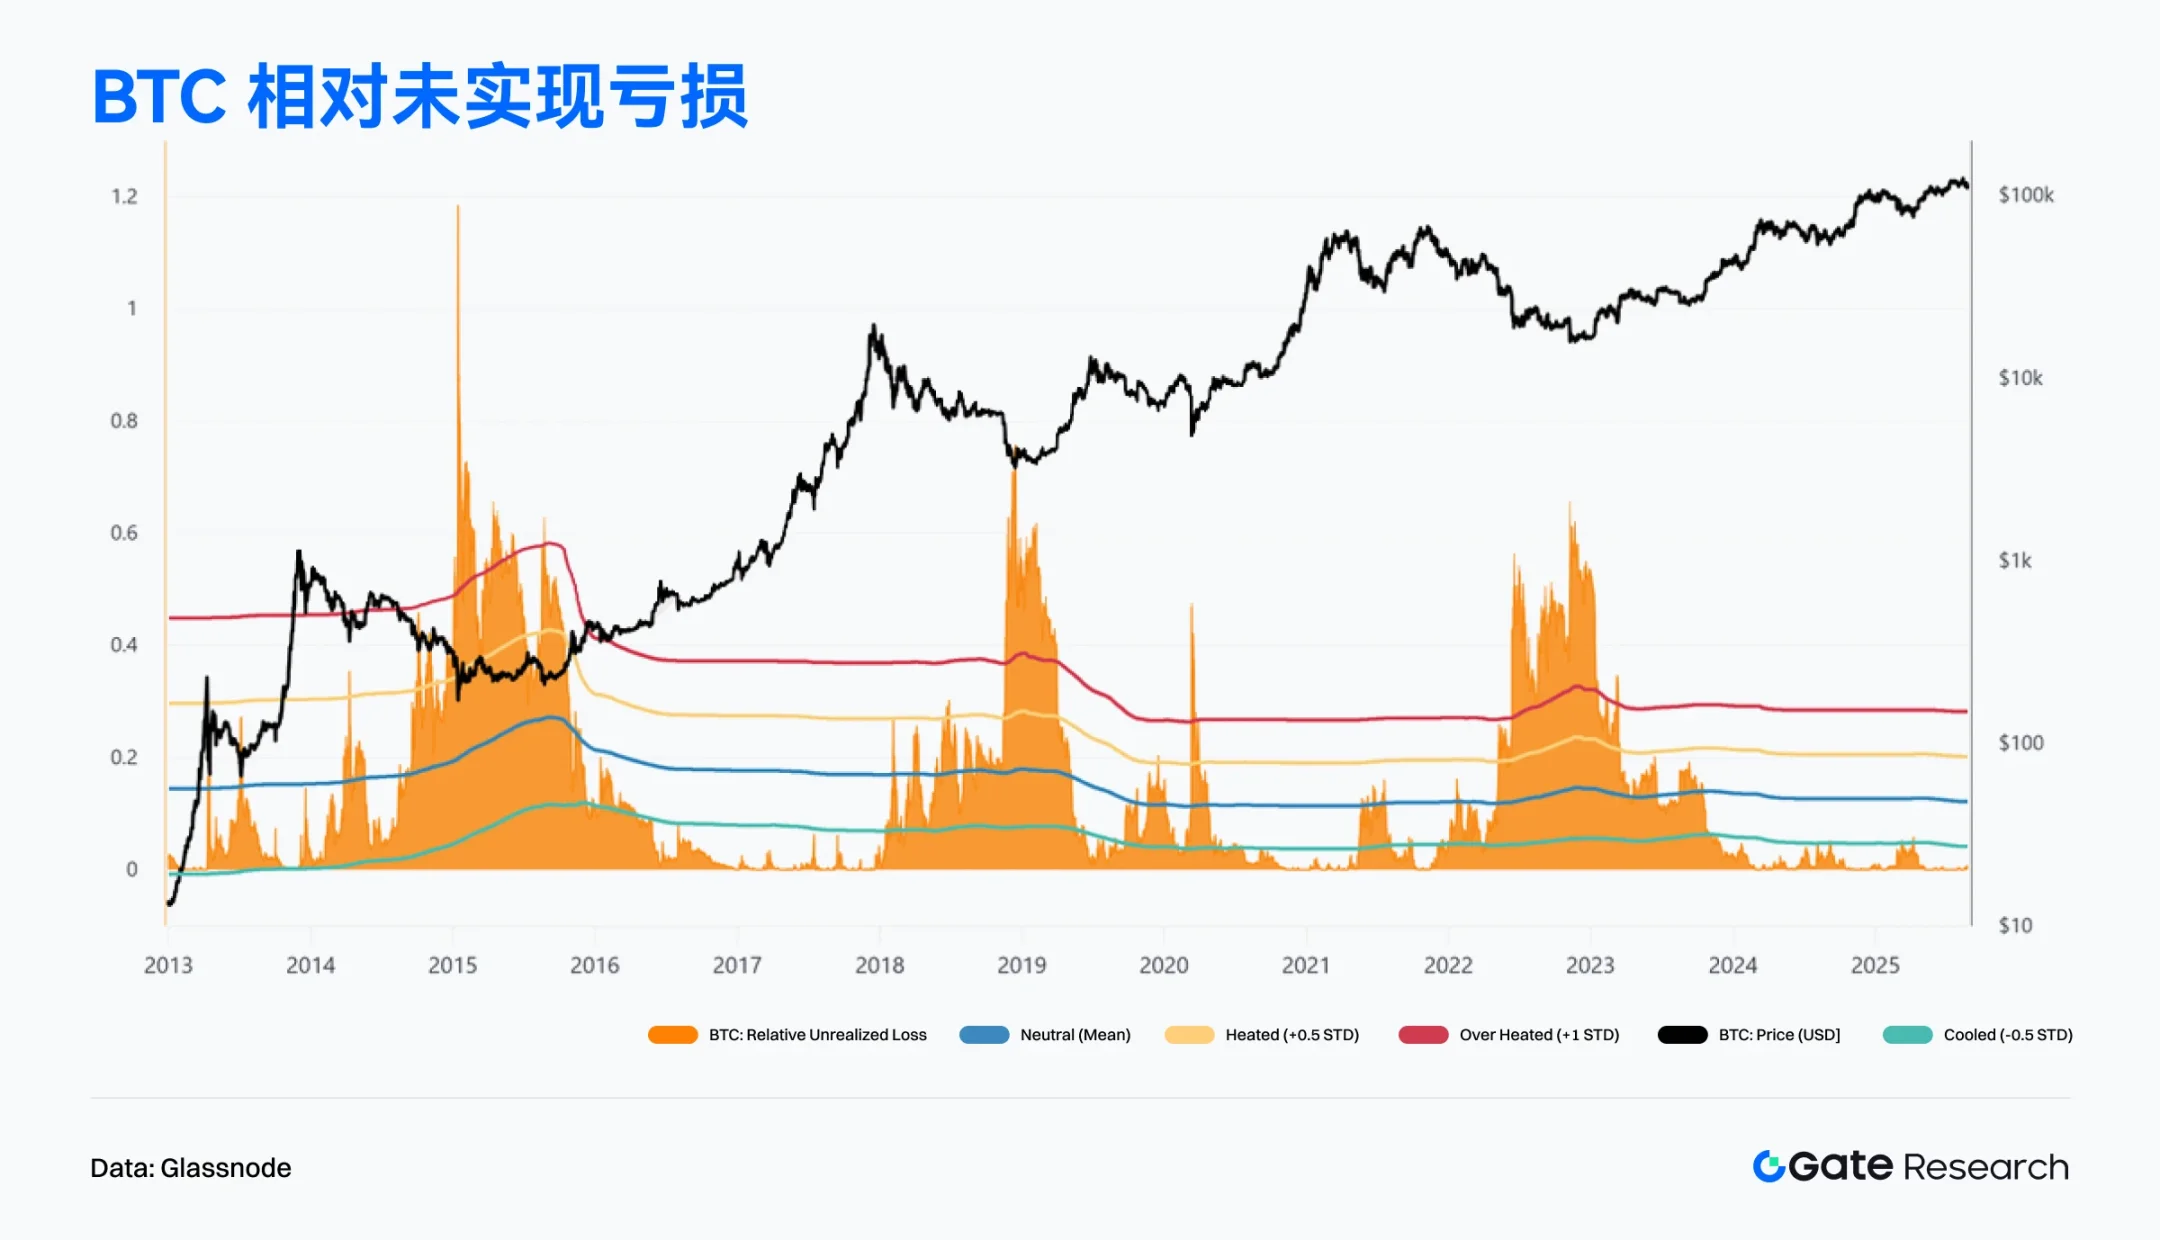
According to Glassnode data, BTC's relative unrealized loss indicator (Relative Unrealized Loss) soared during the 2023 bear market, reflecting the great pressure of losses on investors at the time. However, since the end of 2023, the indicator has fallen back rapidly and remained at a low level from 2024 to 2025, staying below -0.5 standard deviations for a long time. [11]
Compared to historical cycles, the current relative unrealized loss level is only approximately 0.5%, significantly lower than the extreme values of over 30% seen during the 2018–2020 and 2022–2023 bear markets. This suggests that despite the recent pullback from BTC's $124,000 high, which has increased unrealized losses for short-term holders, the overall market's loss pressure is not severe. Overall, this indicator suggests that the market has not entered the extreme panic phase of past deep bear markets, and the investor structure remains relatively healthy. In other words, the current pullback is more like a phased correction in the upward trend than a trend reversal.
Hot Projects and Token Trends
On-chain data indicates that capital and users are gradually converging towards ecosystems with a strong foundation for interaction and deep application. Projects with buzzworthy and technologically innovative capabilities are becoming a new focus of capital. This article will focus on recent high-performing projects and tokens, analyzing the underlying logic and potential impact.
Overview of popular project data
Aave
Aave is a decentralized lending platform that leverages smart contract technology to eliminate traditional financial intermediaries and allow users to trade directly. Known for its innovative lending products, the platform supports multiple cryptocurrencies and employs second-layer solutions to enhance performance. Aave's operating mechanisms include collateralized lending and flash loans, along with a security module to protect the protocol from capital loss. Aave V4 will introduce new features such as a unified liquidity layer and fuzzy interest rate control. Furthermore, Aave Network's proposal will enable it to perform multiple functions as an application chain, including using GHO for fees and integrating Aave V4.
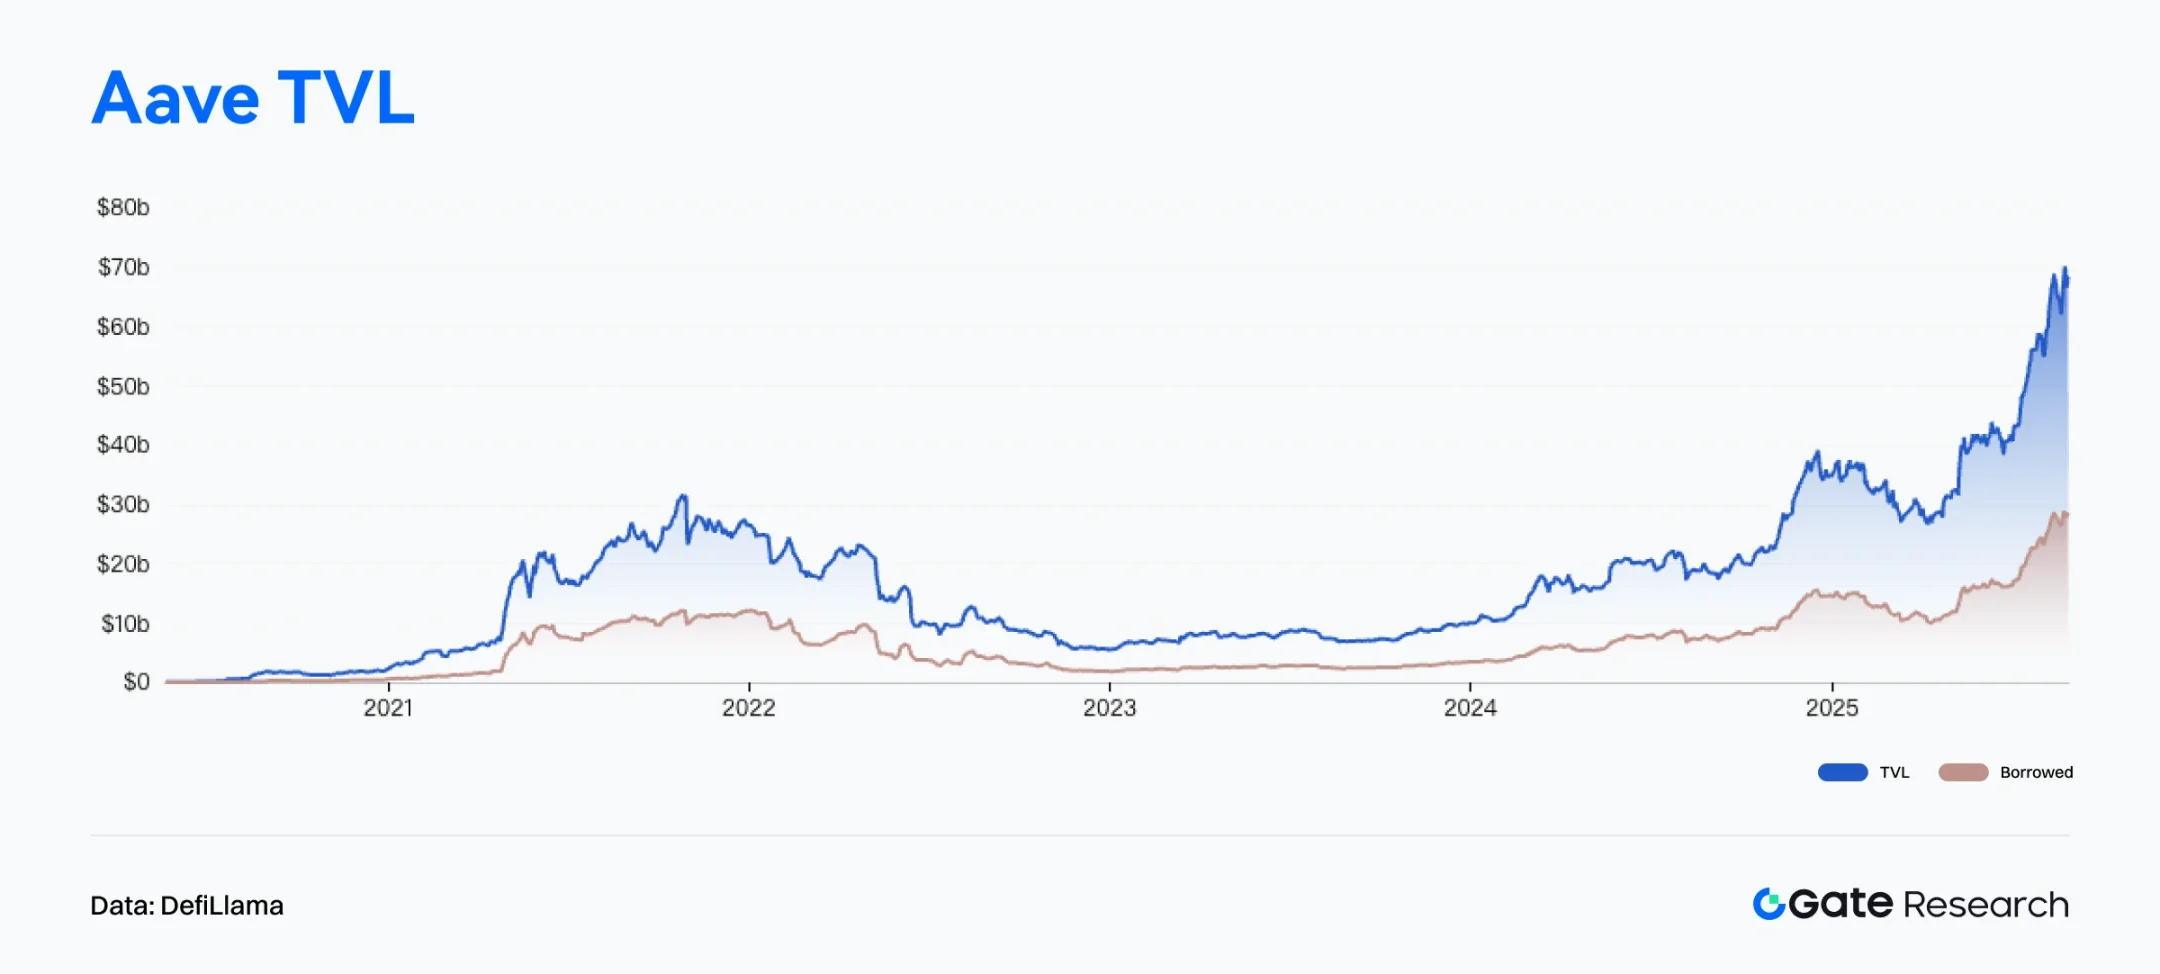
According to DefiLlama data, the total locked value (TVL) of the decentralized lending protocol Aave has exceeded US$41.1 billion, setting a new record high. [12] If the US$28.9 billion in outstanding loans on that day are included, Aave's total capital scale will exceed US$70 billion, ranking among the top 37 banks in the United States (ranked in the top 1.7%). [13] Aave founder Stani Kulechov said that Aave is an open financial network that can provide institutions with a source of income that does not rely on the Federal Reserve, highlighting the structural potential of DeFi to replace the traditional financial system. Currently, Aave continues to lead the DeFi lending field, holding approximately 50% of the market TVL, which is nearly 6 times the size of its second largest competitor Morpho, reflecting the high concentration of user and institutional funds on its security and stability.
Aave Labs recently launched a new platform, Horizon, which aims to provide institutional investors with a lending service that uses tokenized real-world assets (RWA) as collateral to obtain stablecoins. Initially, qualified institutions can use tokenized assets such as government bonds and cryptocurrency holding funds as collateral to borrow stablecoins such as USDC, RLUSD, and GHO. The first batch of supported assets include Superstate Short-Term U.S. Treasury Fund, Circle Income Fund, and Centrifuge's Janus Henderson tokenized product. [14]
The launch of Horizon marks Aave's accelerated expansion into the institutional RWA financing market. By introducing traditional financial assets like government bonds as DeFi collateral, Aave broadens the issuance and use cases for stablecoins while providing institutions with tools for both liquidity and yield management. This not only increases market demand and liquidity for stablecoins and RWAs, but also promotes the convergence of DeFi and TradFi.
In summary, Aave not only maintains its leading position in decentralized lending, but its continued innovation in institutional services also demonstrates a clear strategic vision. With increasingly clear compliance paths and a growing range of collateral assets, Horizon is poised to become a key entry point for institutions into DeFi, further strengthening Aave's core position in the global financial architecture.
Overview of popular token data
$BIO
BIO is the native token of Bio Protocol, a blockchain project focused on decentralized science (DeSci). Combining on-chain governance with token incentives, Bio Protocol aims to create an open research collaboration network involving researchers, patients, and investors. BIO tokens can be used to participate in BioDAO governance, support project incubation, and distribute intellectual property revenue. Staking also grants voting rights and rewards eligibility. Through IP tokenization, research task incentives, and an incubator mechanism, Bio Protocol promotes the on-chain transfer and transformation of scientific research results, making it one of the most representative projects in the DeSci ecosystem.
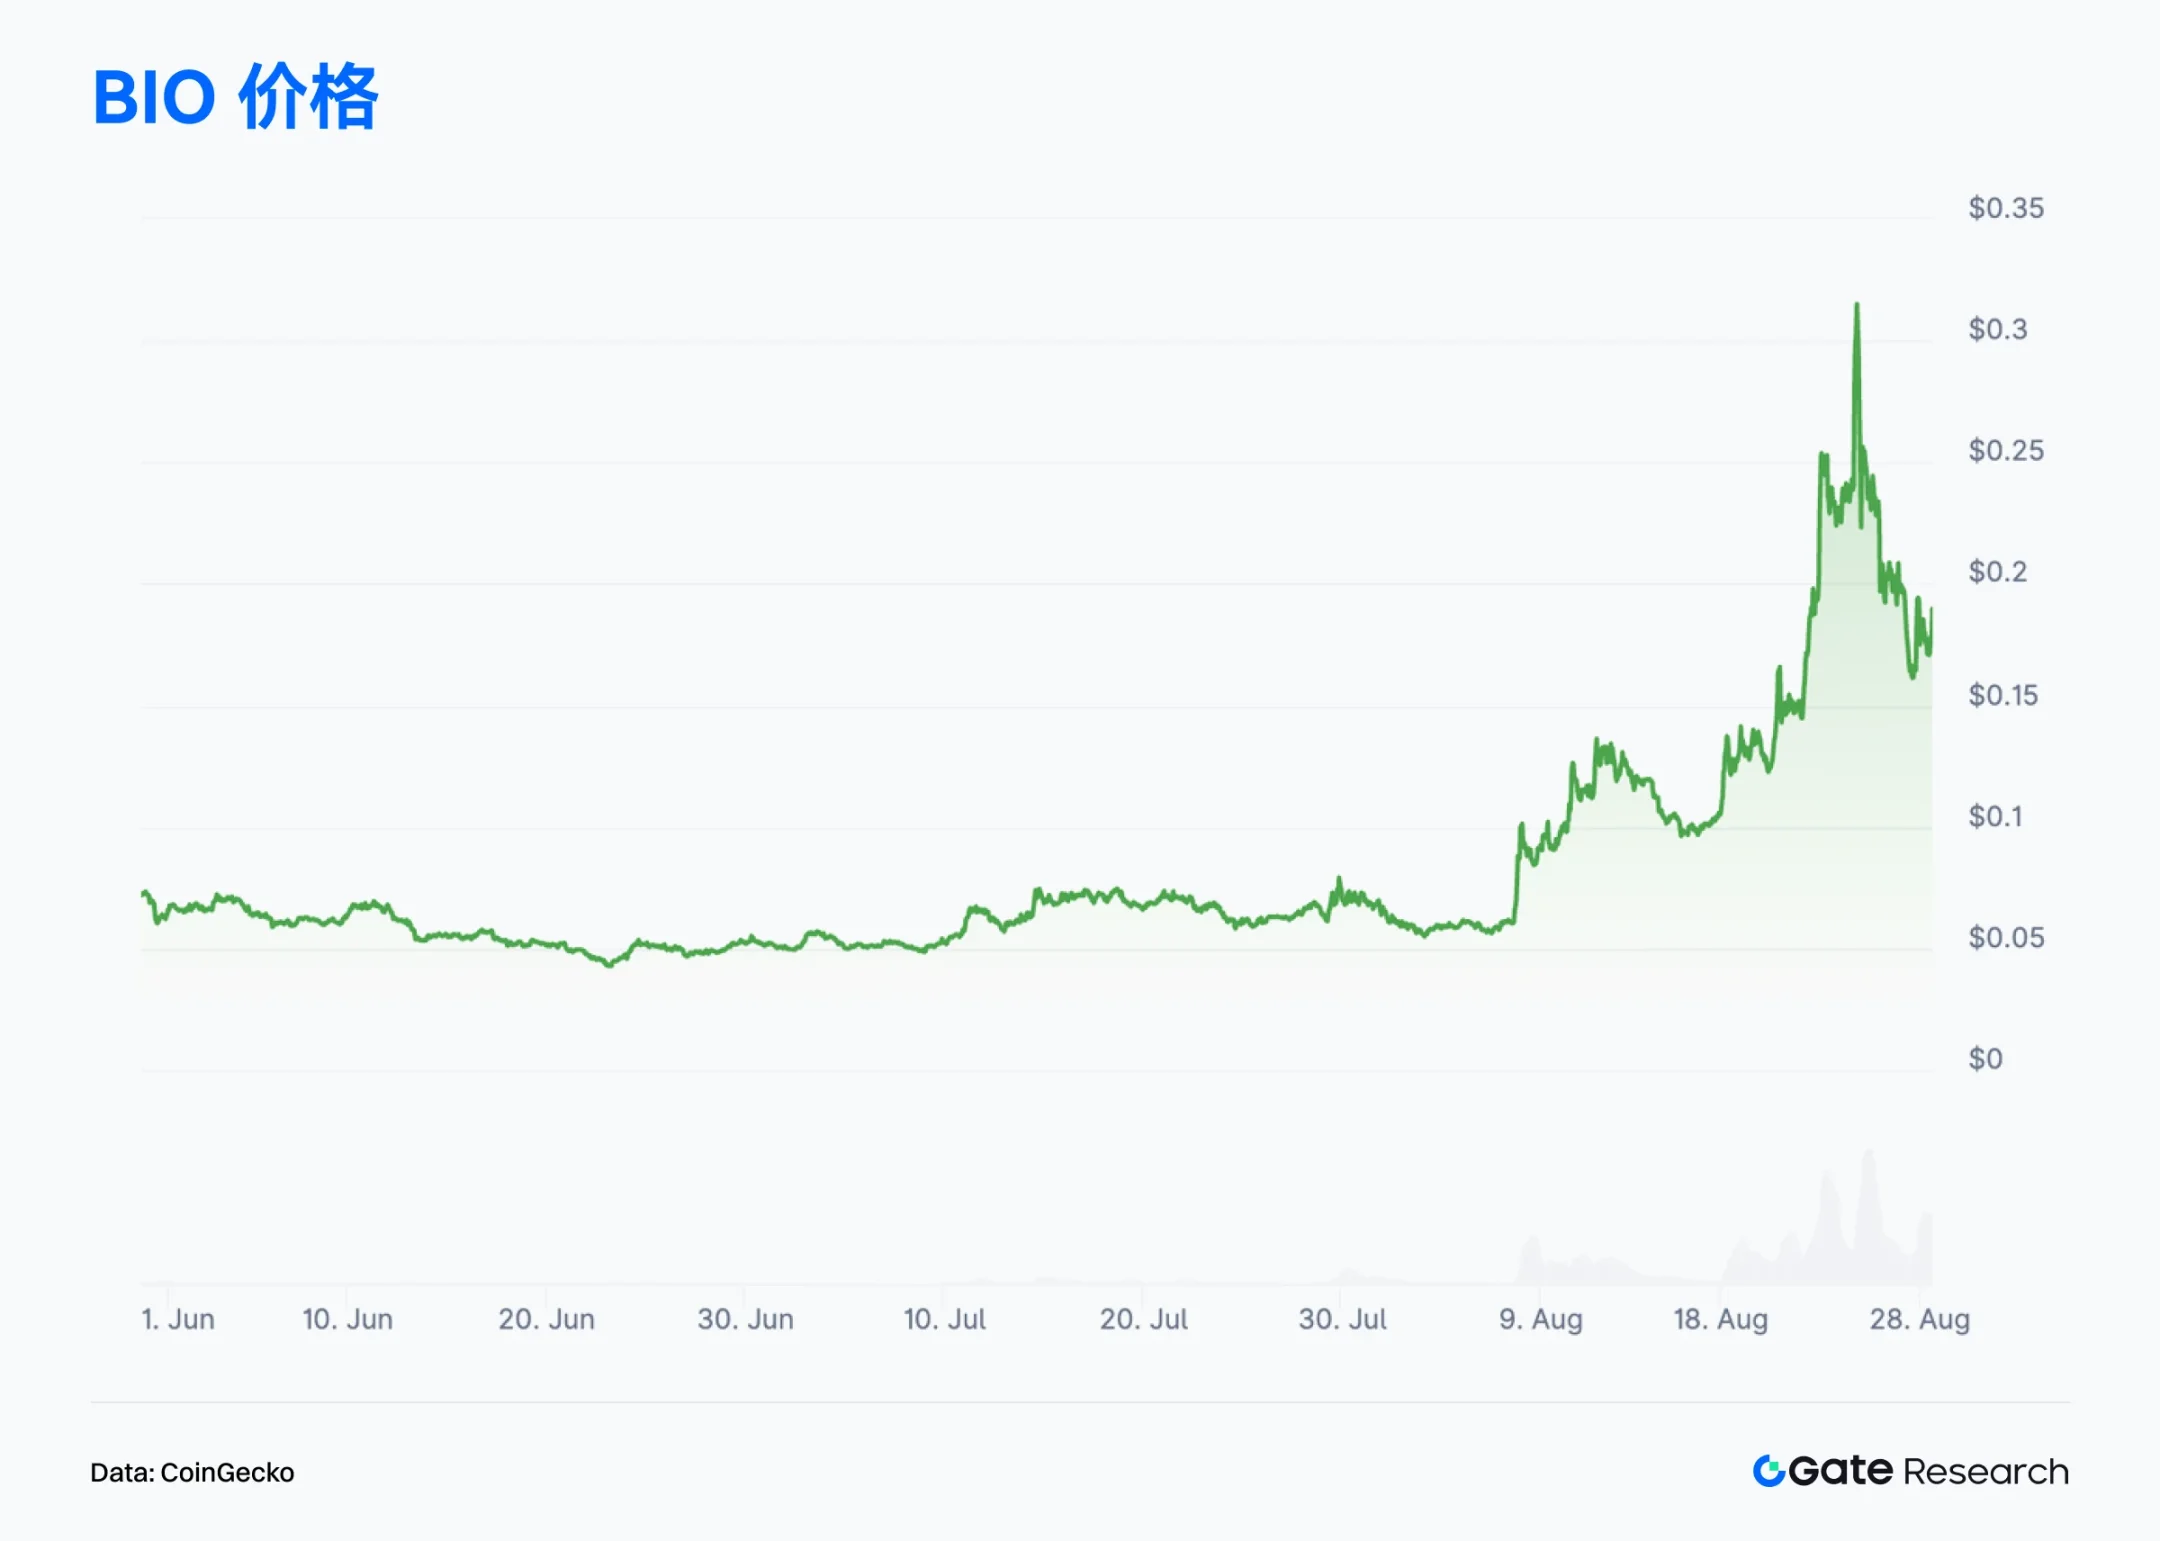
With the official launch of Bio Protocol V2, which introduced new mechanisms such as Launchpad, a staking points system, and a liquidity engine, the total amount of staked BIO exceeded 100 million within the first week of launch, and the token market value quickly doubled to $200 million, reigniting market attention to the DeSci track. [15] The price of BIO started at $0.10 on August 18 and rose to a high of $0.315 on August 24, a single-week increase of nearly 200%, becoming one of the most outstanding on-chain assets in August.
Regarding ecosystem expansion, Bio Protocol has generated over $4 million in revenue from liquidity fees and is preparing to integrate with leading DeFi protocols, including launching a dedicated lending market for Bio. The team also plans to launch Bio Copilot, a decentralized research agency. This will automate research processes such as drug screening, clinical operations, and funding allocation, accelerating the development of high-frequency, intelligent, and iterative research.
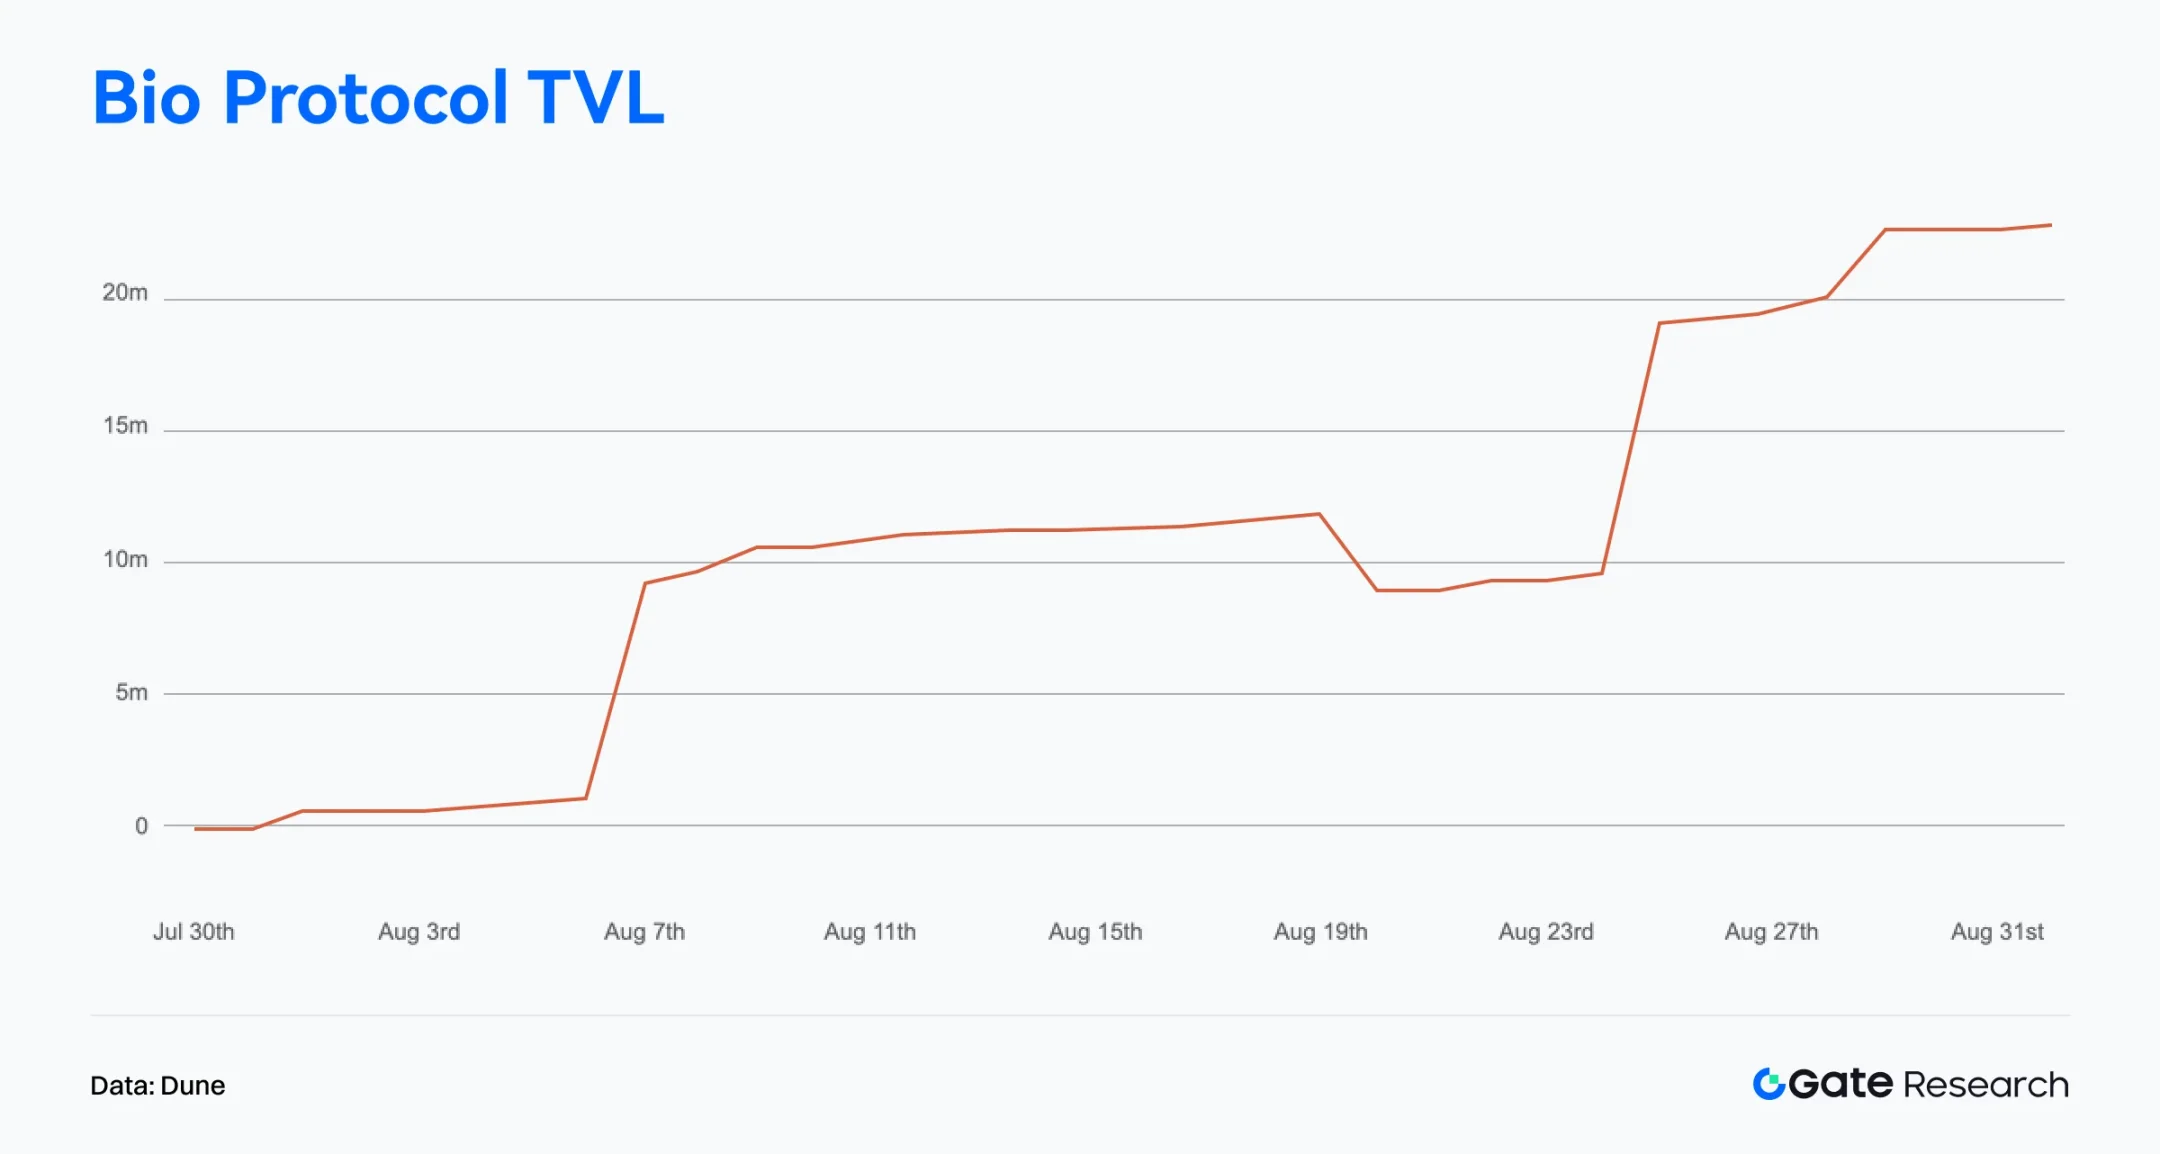
On-chain data also shows that funds are flowing in at an accelerated pace. According to Dune data, Bio Protocol's TVL has exceeded US$22 million, up more than 110% in the past seven days. Analysts believe that the increase in the medium- and long-term lock-up ratio is expected to bring continued upward momentum to BIO, but the high proportion of short-term positions may still trigger periodic selling pressure; if long-term funds continue to flow in, BIO is expected to usher in a new round of rising cycle. [16]
In summary, Bio Protocol, with its precise positioning and continuous innovation in the decentralized scientific research (DeSci) space, has not only achieved remarkable breakthroughs in on-chain data and market performance, but has also successfully attracted deep participation from both capital and the community through its V2 upgrade, liquidity optimization, and ecosystem development. With the continued advancement of products like Bio Copilot, the project is expected to make substantial progress in promoting the on-chain integration of the scientific research industry chain and enabling research automation. With continued capital inflows and further optimization of its lock-up structure, Bio Protocol is poised to maintain its leadership in the DeSci space, becoming a key bridge connecting scientific innovation with on-chain finance.
Summarize
In August 2025, on-chain activity and capital flow structures continued to diverge. Solana maintained its top spot with over 29 billion monthly transactions, demonstrating its dominance in high-frequency interactions. Ethereum, while achieving consecutive monthly highs in mainnet transaction volume, maintained its leading position in fee income and net capital inflow, solidifying its core position in high-value interaction scenarios and institutional deployments. Base has steadily increased, with active addresses exceeding one million, continuing to expand its influence within the Layer 2 community. Regarding capital, Ethereum saw over $2 billion in net inflows in a single month, driving both ETH prices and ETF assets under management to new highs. WorldChain and Solana also led the way in attracting capital. Meanwhile, sidechains such as Polygon and Unichain, as well as some Layer 2 projects, faced capital withdrawals, further evolving the on-chain landscape towards a "stronger, stronger" landscape.
For Bitcoin, on-chain indicators demonstrate a robust structure amidst high-level fluctuations. Capital inflows have slowed, but profit-taking pressure remains relatively mild, limiting selling pressure. The cost basis has established solid support in the $93,000–$110,000 range, and short-term pullbacks have not breached key support levels. Unrealized losses remain low, limiting overall pressure. Overall, this correction is more of a phased correction than a trend reversal, and the structural foundation for continued gains remains in place after the high-level fluctuations are resolved.
Aave and Bio Protocol are currently in the spotlight. Aave, a leading DeFi lending platform, boasts a TVL exceeding $41.1 billion and a total capital base exceeding $70 billion. Through Aave V4 and the Horizon platform, it is accelerating its deployment of RWA collateral and institutional services, strengthening its position in the convergence of DeFi and TradFi. Bio Protocol, with its V2 upgrade doubling its market capitalization to $200 million and a nearly 200% weekly price surge, also plans to launch Bio Copilot to promote scientific research automation, demonstrating strong growth potential in the DeSci field.
References:
1. Artemis, https://app.artemisanalytics.com/chains
2. DefiLlama, https://devillama.com/chain/ethereum?activeAddresses=false&tvl=false&groupBy=monthly&dexsVolume=true
3. Artemis, https://app.artemisanalytics.com/chains
4. Artemis, https://app.artemisanalytics.com/chains
5. Artemis, https://app.artemisanalytics.com/flows
6. CoinGecko, https://www.coingecko.com/en/treasuries/ethereum
7. DefiLlama, https://defillama.com/protocol/pendle
8. Glassnode, https://studio.glassnode.com/charts/ba1ec93d-85f4-41fe-5606-798a2f30013a?a=BTC
9. Glassnode, https://studio.glassnode.com/charts/22ef95fa-bed1-4a18-5e56-a74093870d1a?a=BTC
11. Glassnode, https://studio.glassnode.com/charts/e710c5a0-3f26-4e8b-7fa2-28ef87c92b73
12. DefiLlama, https://devillama.com/protocol/aave?events=false&borrowed_tvl=true
13. Aaverank, https://aaverank.com/
14. X, https://x.com/defisebs/status/1960790694509076811
15. CoinGecko, https://www.coingecko.com/en/coins/bio-protocol
16. Dune, https://dune.com/tk-research/bio-launchpad