Author: Coinbase Institutional Research
Key points
1. Despite the continued panic gripping the crypto market, we believe the October liquidation events are more likely the prelude to a medium- to long-term uptrend than a sign of weakness, creating a good start for the fourth quarter rally.
2. However, it may take several months for the market to fully stabilize, and in the medium term it is more likely to show a gradual recovery rather than soaring to a record high.
3. Over the past 30 days, "smart money" in the crypto space has flowed mainly around the EVM technology stack, and away from Solana and BSC.
summary
Following the massive liquidation event on October 10th, we believe the cryptocurrency market has reached a short-term bottom, with current market positioning significantly improved. The market appears to have simply reset rather than crashed. We believe this sell-off has restored market leverage to a healthier structural state, which could provide support for the medium to short term. However, a slow climb rather than a direct surge to all-time highs is more likely in the coming months.
From a technical perspective, this deleveraging event is more of a fundamental market adjustment than a solvency crisis, although the altcoin sell-off and market maker order cancellations did put pressure on the riskiest sectors of the cryptocurrency market. On the positive side, we believe this technically driven rally indicates that the fundamentals of the crypto market remain robust. Institutional investors—most of whom were unaffected by the leverage liquidations—may lead the next upward move. While the macroeconomic environment is more complex and riskier than at the beginning of the year, it remains generally supportive.
Observing the "smart money" in this space (according to a Nansen report), fund flows are shifting towards EVM stacks (such as Ethereum and Arbitrum), while momentum is waning for Solana and Binance Smart Chain (BSC). It's important to note that we use smart money flows only as a screening tool—not a buy signal—to identify market depth, incentive mechanisms, and the distribution of developer/user activity across protocols, decentralized exchanges, and blockchains. Meanwhile, stablecoin data points to capital rotation rather than new fund inflows, suggesting that short-term market rallies will continue to rely on tactical incentives and narrative-driven rotation effects.
Grain robbery
A well-known anecdote circulates in the commodities trading world: the "Great Food Robbery." The event occurred in 1973, but despite the name, it wasn't actually a robbery. In reality, it was the Soviet Union systematically and secretly withdrawing wheat and corn stocks from the open market over a month. This action went undetected for a long time until global food prices surged by 30%-50%, revealing a massive crop failure in the Soviet Union—leading to a dangerously low global food supply.
The cryptocurrency liquidation chain reaction triggered by tariffs on October 10th—leading to a 40%-70% plunge in many altcoins—bears a striking resemblance to the information dissemination mechanism of the events of that year. In both incidents, the information asymmetry during periods of liquidity shortage created significant market misalignment, causing disproportionate damage to assets with lower liquidity and higher beta coefficients.
Figure 1: The largest liquidation event in cryptocurrency history
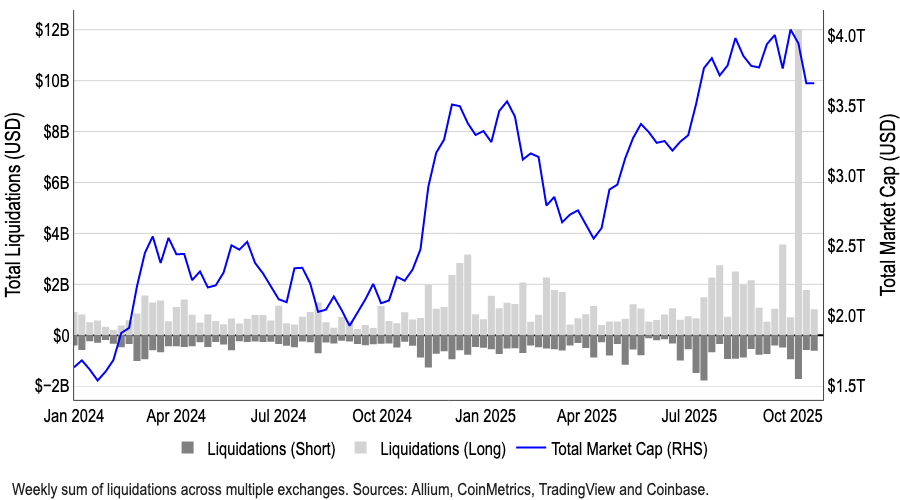
In 1973, U.S. officials failed to detect a global food shortage, stemming from flaws in the agricultural monitoring system. Senator Henry Jackson accused them of either "unbelievable negligence" or "deliberate cover-up." This incident spurred the development of satellite crop monitoring technology to prevent future information asymmetry.
The chain reaction of crashes in the cryptocurrency space stemmed not only from the information gap but also from flawed execution mechanisms: altcoin liquidity was scattered across multiple exchanges, and decentralized protocols automatically liquidated over-collateralized altcoin positions when health indicators deteriorated. This often created self-reinforcing selling pressure during price declines. Not to mention that market makers now primarily hedge risk by shorting altcoins (due to their significantly higher beta compared to large-cap coins, allowing them to maintain smaller position sizes). However, due to automatic deleveraging (ADL), many institutions suddenly liquidated their positions and withdrew their buy-side liquidity, exacerbating the sell-off.
Both events confirm a timeless market truth: when liquidity dries up and information asymmetry intensifies, the corner of the market with the highest beta and leverage becomes a pressure relief valve, bearing the brunt of forced selling. But what happens next?
Recovery pattern
We believe this sell-off is a necessary reset in the crypto market, rather than a cyclical peak, and may pave the way for a slow rise in the coming months. Prior to the events of October 10th, our main concern was that the current bull market cycle might be ending prematurely. In fact, our survey conducted from September 17th to October 3rd showed that 45% of institutional investors believed the bull market was nearing its end.
The sell-off has actually strengthened our belief that the crypto market has directional upside potential. However, in the coming months, cryptocurrency positioning will depend more on market restructuring than on headline-driven catalysts. The liquidation cascade exposed vulnerabilities in collateral standards, pricing mechanisms, and cross-platform transfer resilience.
Figure 2. The brief but dramatic impact of leverage reshapes the crypto market landscape.
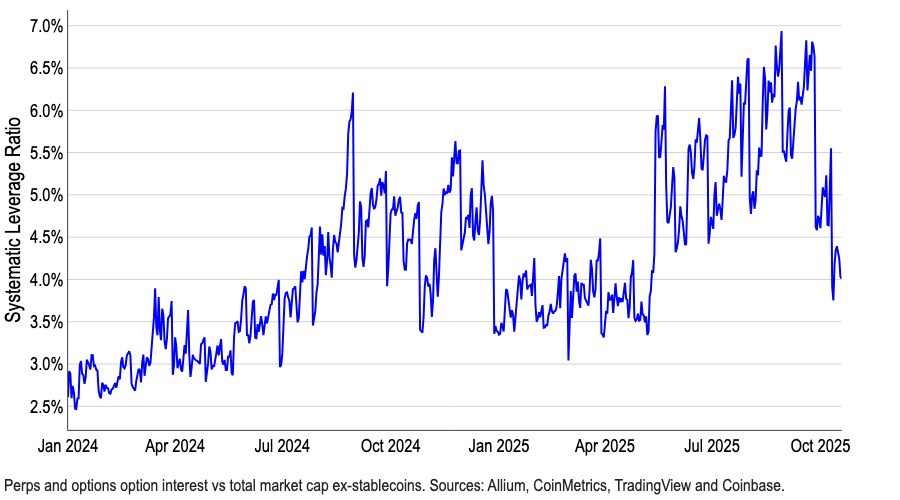
However, leverage levels have largely reset – our systemic leverage ratio (based on total open interest in derivatives divided by total cryptocurrency market capitalization, excluding stablecoins) shows current levels are only slightly higher than at the beginning of the year (Chart 2). We believe this metric will be one of the most critical monitoring data points in the short to medium term. The current leverage ratio suggests that the market will continue to face intermittent liquidity gaps and a sharper risk tail until risk management measures are coordinated and market maker depth fully returns to normal.
Looking ahead, we expect market momentum to be primarily driven by institutional inflows—institutional investors were largely unaffected by this deleveraging event. Most institutions either maintained low leverage or concentrated their investments in large-cap assets, while retail-dominated altcoins bore the brunt of the liquidation chain reaction. As institutional investment sentiment recovers, the cryptocurrency market is expected to rebound, but this process could take several months.
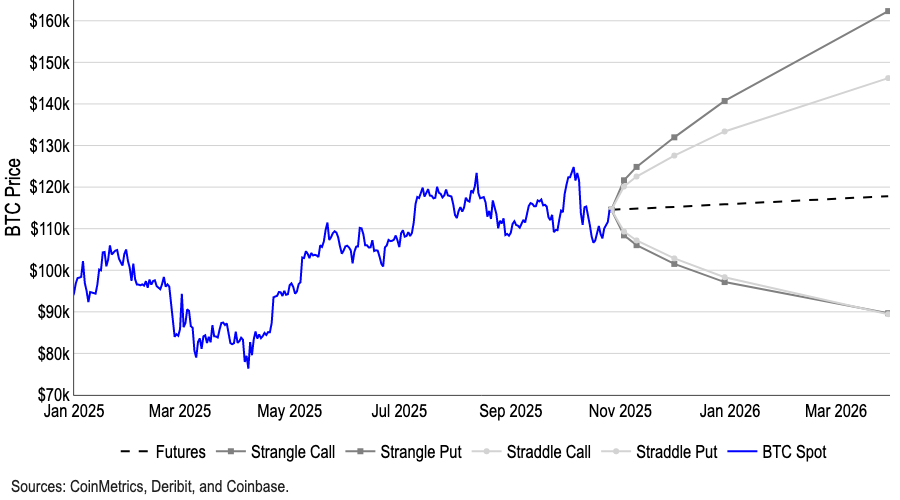
Therefore, we expect Bitcoin's dominance to gradually increase over the next 2-3 months, which may put downward pressure on the ETH/BTC and altcoin/BTC trading pairs before the final market rotation. It should be noted that, based on the break-even point of straddle and sling option strategies, the current market's implied probability distribution for Bitcoin's price over the next 3-6 months ranges from $160,000 to $90,000, and the expectation shows an upward asymmetric bias (Figure 3).
Figure 3. Implied distribution of expected BTC price based on the break-even point of straddle and strode options.
Tracking fund flows
We believe that fund flows are the most direct barometer of market participants' confidence after a downturn. Following recent deleveraging, we have observed price overshooting and a blurring of market narratives. To understand position dynamics, we recommend focusing on the current (re)deployment directions of "smart money"—including investment funds, market makers, venture capital firms, and consistently high-yield traders.
Tracking these fund flows can reveal which ecosystems are regaining depth, incentive mechanisms, and developer/user activity—i.e., hubs of short-term opportunities—and noteworthy protocols, decentralized exchanges, and blockchains. However, this doesn't mean market participants should directly buy the native tokens of these platforms, as on-chain footprints may reflect yield farming, liquidity provision, basis/capital arbitrage, or airdrop deployments. Furthermore, it's difficult to determine whether smart money buying is tactical (incentive-driven) or sustainable. We believe a more sensible approach is to view smart money flows as a tool for identifying opportunities.
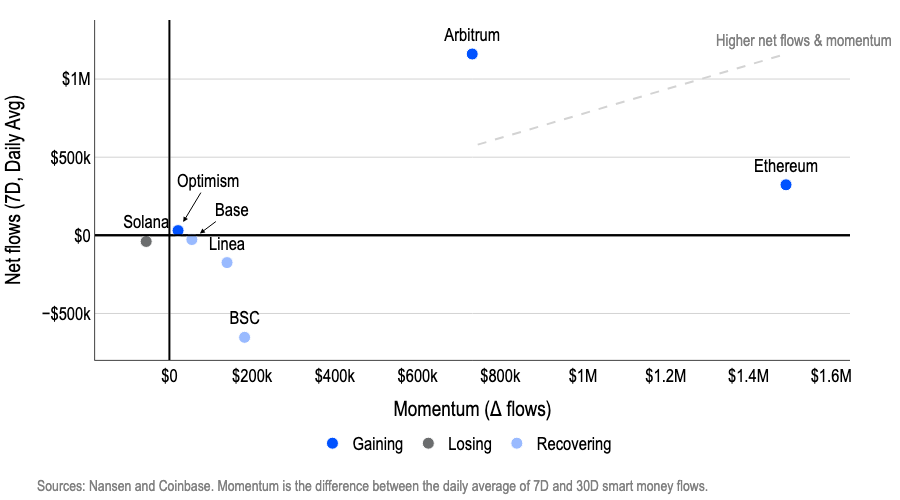
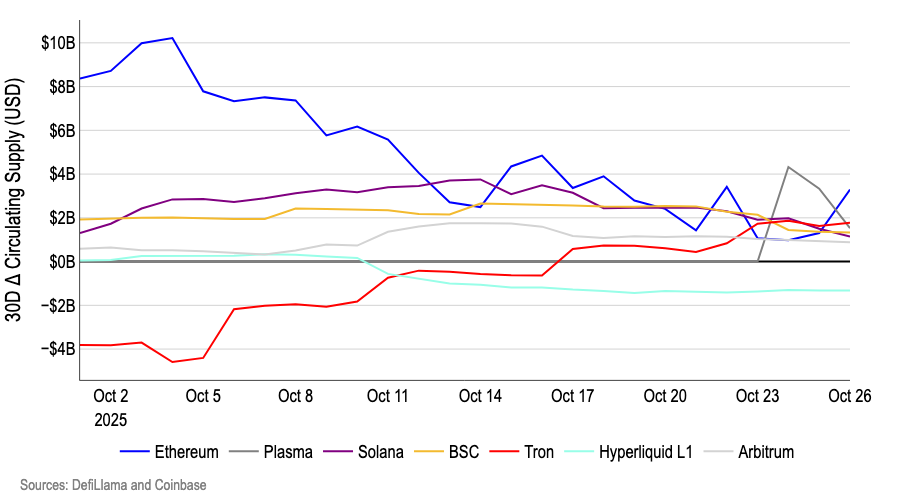
After October 10th, funds shifted to Ethereum L1/L2 (i.e., Ethereum and Arbitrum), while Solana and BSC lost momentum. Ethereum and Arbitrum led in net inflows over 7 days, and their momentum has been steadily increasing over the past 30 days (Figure 4). Meanwhile, funds are withdrawing from Solana and BSC; while the outflow from BSC has eased somewhat, it remains negative.
Figure 4. Smart Money Flows – By Chain
The catalysts for these fund flows vary. For example, Arbitrum restarted its incentive mechanisms and DAO programs in October (such as DRIP Epoch 4, which directs rewards to Aave lending/liquidity, Morpho, and gaming-related activities), coinciding with a redeployment of liquidity and reigniting the flywheel effect.
We believe it's wise to closely monitor tokens on the Base chain to capture potential inflection point trading opportunities. Base chain activity surged this weekend (October 25-26): the x402 ecosystem experienced parabolic growth, and Farcaster's acquisition of the Clanker token offering platform spurred new token issuances and user traffic. This growth builds upon previous catalysts—the ongoing Base token speculation frenzy, the open-source Solana bridging solution, Zora's launch on Robinhood, and Coinbase's acquisition of Echo—all of which have expanded application scenarios and created more opportunities for liquidity rotation.
Meanwhile, in the sector rotation since October 10th, the "practicality + return" logic has replaced speculative operations as the mainstream. In the market misalignment after the crash, yield protocols have led the flow of smart money, restarting double-digit APY (such as fixed/floating yield combinations and funding rate arbitrage), while the NFT/metaverse/gaming sectors have been driven by strategy-driven mechanisms (such as PunkStrategy's deflationary NFT trading cycle) and major transactions (such as Coinbase's acquisition of UPONLY).
Figure 5. Fund Flows – By Sector
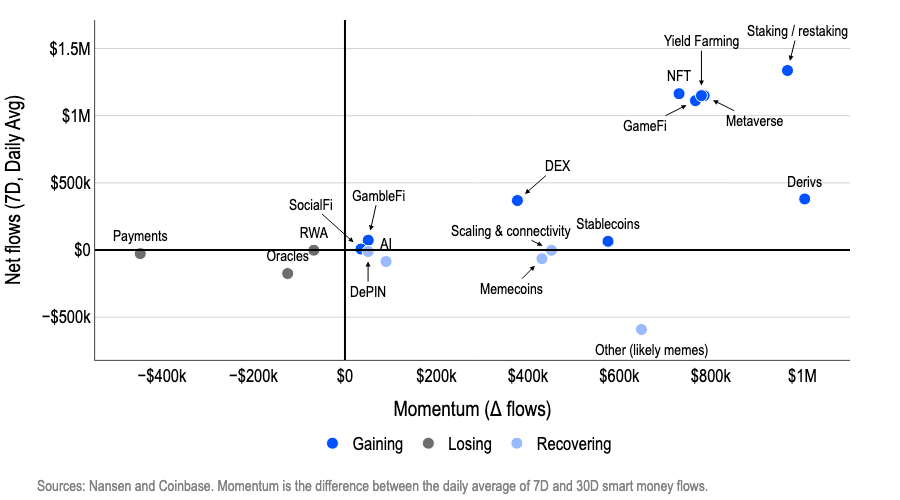
The staking/re-staking theme continues to strengthen, with institutional products grabbing headlines—Grayscale launches its first Ethereum and SOL-staking-based US exchange-traded product. In short, smart money is converging on sectors with clear revenue paths, reliable incentive mechanisms, and institutional access points, and is using stablecoins to achieve optimal risk reallocation (Figure 5).
Stablecoin flow data also indicates a current trend of capital rotation rather than a surge of new funds. Over the past month, except for Tron, the 30-day growth rate of stablecoins on most mainstream blockchains has shown a downward trend (Figure 6). We believe this suggests that post-crash fund flows are a redistribution rather than new additions—liquidity is selectively shifting between protocols with real catalysts, but the system has not yet seen a general surge in stablecoin supply. In practical terms, this means that the rebound will still rely on tactical incentives and narrative-driven rotation until a clear expansion of the circulating supply of stablecoins leads to a broad-based rally.
Figure 6. Stablecoin Supply Momentum – By Chain
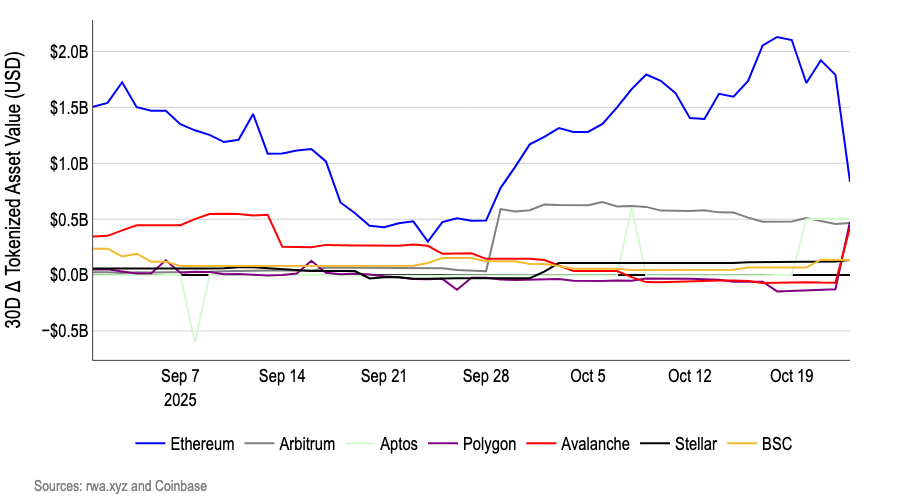
The tokenized asset sector is a key area of focus for institutions. In October, BlackRock's BUIDL injected approximately $500 million into Polygon, Avalanche, and Aptos (Figure 7). This total injection of approximately $1.5 billion highlights the value of real-world assets (RWAs) as a resilient narrative—attracting traditional financial participation during volatile periods by providing stable returns (tokenized government bond yields of 4-6%) and liquidity, while avoiding the speculative bubble liquidated in the chain reaction of crashes on October 10.
These deployments are gradually breaking through the limitations of Ethereum (BUIDL's initial stronghold) and fully leveraging the advantages of each chain: Polygon offers Ethereum-compatible scalability and low fees; Avalanche, with its high-throughput subnet, is an ideal choice for institutional-grade DeFi integration; and Aptos handles complex assets with its Move language security mechanism. Although this may seem like a selective expansion by a single player (BlackRock), we believe that against the backdrop of increasing uncertainty in the cryptocurrency market, its efforts to expand access to RWAs (Real-World Assets) highlight the strategic value of the RWA space as a future growth driver.
Figure 7. Real-world asset flows – categorized by blockchain
Don't ignore the macro environment
Finally, it must be remembered that cryptocurrencies are still trading in a highly complex and increasingly risky macroeconomic environment. This sell-off has eliminated the excess leverage often seen in late-cycle bull markets. However, multiple macroeconomic factors continue to impact investor confidence: trade frictions (such as tariff policies), geopolitical conflicts (such as US sanctions against Russian oil producers), surging fiscal deficits (both in the US and globally), and overvaluation in other asset classes.
Despite the Federal Reserve's accommodative monetary policy, the yield on the 10-year U.S. Treasury bond has remained around 4.0%, with its trading range locked between 3.5% and 4.5%. This stability partly explains our tolerance for a steepening yield curve (which typically flattens during periods of prolonged easing). However, we believe the steepening trend may continue, and a sudden surge in yields could pose a downside correction risk to risky assets such as U.S. stocks and cryptocurrencies. This could happen, for example, if fiscal buffers fail.
On the other hand, if long-term yields do indeed rise with US economic growth, it reflects stronger economic fundamentals rather than policy concerns. Faster nominal growth and productivity gains can absorb higher discount rates, thus providing strong support for risk assets, including cryptocurrencies. It's worth noting that we believe economists currently generally underestimate productivity levels—partly because factors such as artificial intelligence are enhancing labor efficiency in ways that official statistics fail to fully capture.
Figure 8. Increase in US labor productivity (10-year annualized growth rate)
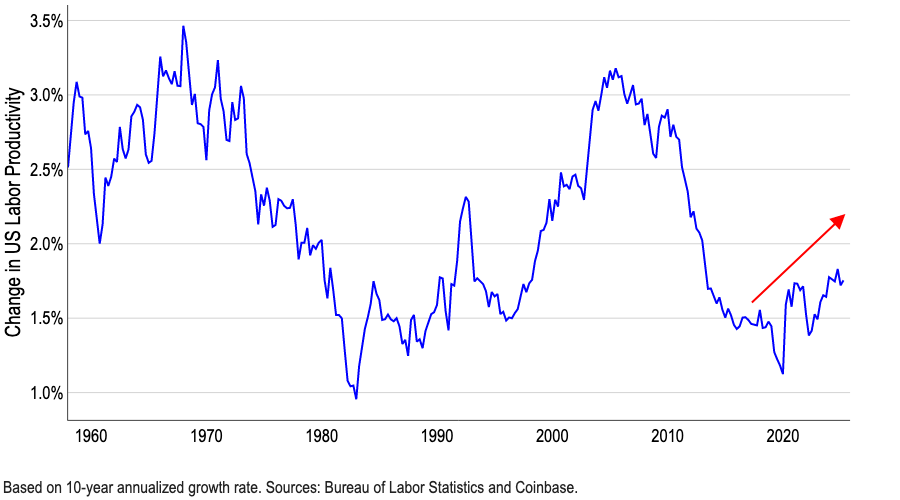
If this is true, it suggests that the impact of macroeconomic fluctuations on risky assets through the discount rate channel may be weakening. This would allow the drivers of cryptocurrencies to shift back to endogenous factors such as liquidity, fundamentals, portfolio allocation, and favorable regulatory developments for cryptocurrencies (e.g., the U.S. Crypto Market Structure Act).
in conclusion
Overall, the current cyclical phase of the crypto market remains highly debated, but we believe the recent leverage liquidation has laid the foundation for a slow upward trend in the coming months. Favorable macroeconomic factors such as the Fed's interest rate cuts, ample liquidity, and regulatory changes supporting cryptocurrencies like the GENIUS/CLARITY Act continue to support bullish expectations and could extend this cycle into 2026.
However, the flow of smart money after October 10th appears more like a selective re-embracing of risk rather than a large-scale return to risky assets. These funds are shifting towards EVM stacks (such as Ethereum and Arbitrum) and the "utility + yield" sector, while inflows into Solana and BSC have slowed, and stablecoin growth has also decelerated. This suggests a redistribution of capital towards specific verticals, rather than a systemic injection.
Meanwhile, significant RWA fund flows indicate that institutions are cautiously expanding their on-chain presence through multi-platform strategies. In practical terms, we believe the short-term rebound will remain concentrated in areas where incentive mechanisms, product launches, and institutional channels converge, although a more sustainable cryptocurrency price trend may require an overall liquidity recovery first. While crypto market sentiment remains in "fear" territory, recent leveraged liquidations are a harbinger of medium- to long-term strength, laying the foundation for further gains in the first quarter of 2026.