By: Bitcoin Magazine Pro
Translation: Blockchain in Vernacular
Bitcoin’s price cycles have long been a topic of interest for investors and analysts. By comparing the current trend with past cycles, we can gain insight into its potential price movements. Especially as Bitcoin appears to be nearing the end of a consolidation period, many are wondering if the next leg up is just around the corner.
1. Comparison of Bitcoin Cycles
First, it is crucial to understand how Bitcoin has performed since reaching its recent cycle low. As the data is analyzed, a clear picture gradually emerges: Bitcoin's current price action (black line) is showing a similar pattern to previous bull cycles. Despite a period of consolidation with little price volatility, this cycle shows some important similarities when compared to the 2015-2018 (purple line) and 2018-2022 (blue line) cycles.
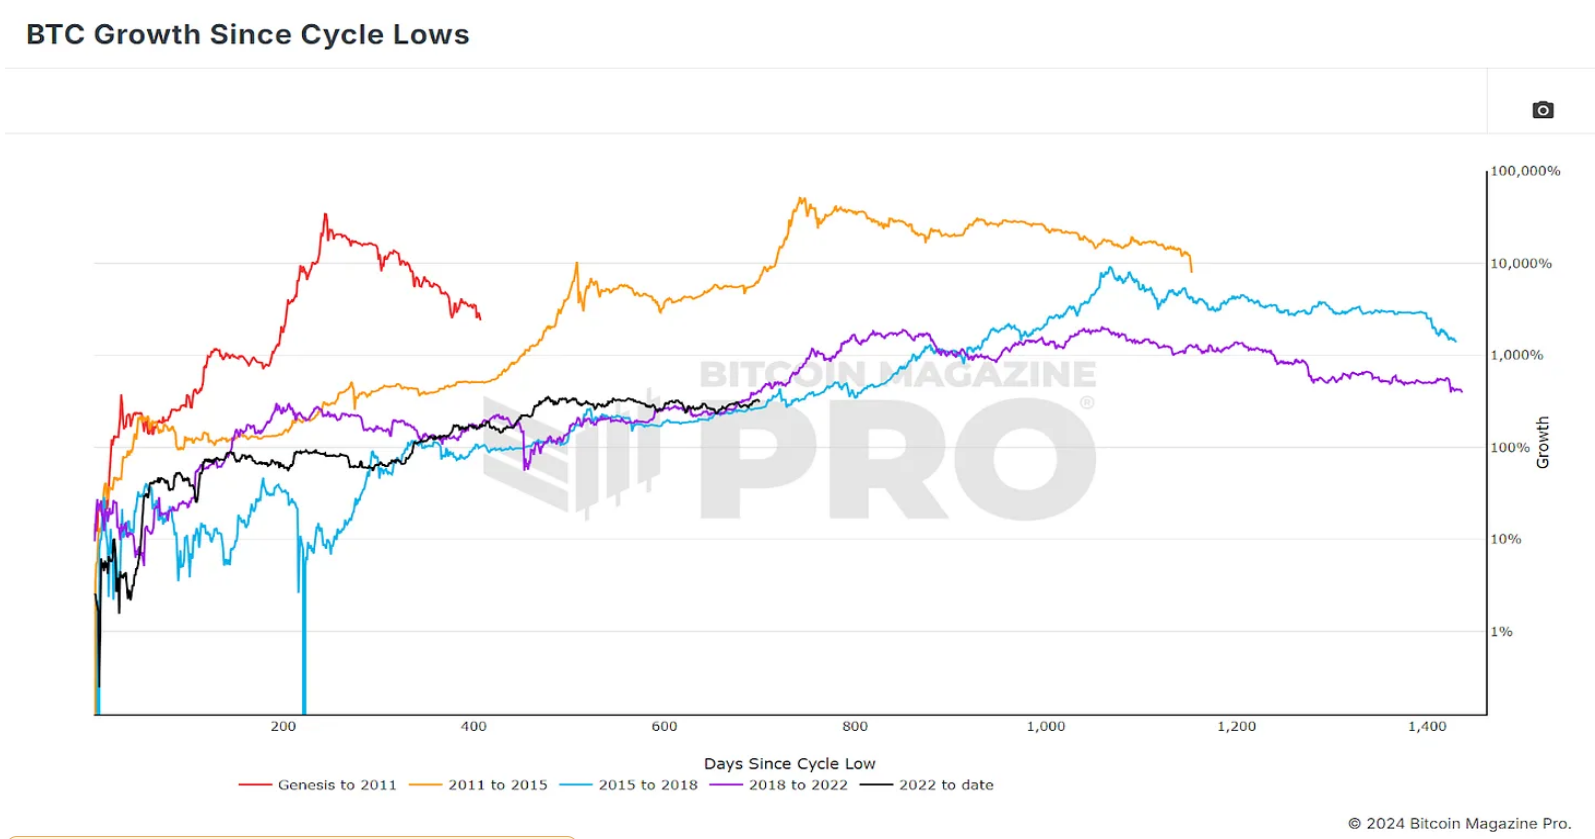
Figure 1: BTC’s growth since the cycle low, showing similarities to the two previous cycles.
In terms of percentage gains, the current situation is comparable to the cycles in 2018 and 2015. However, such comparisons are only superficial, and price action alone does not reveal the full picture, so we need to delve deeper into investor behavior and other indicators that influence the Bitcoin market.
2. Investor Behavior
A key metric that can reveal investor behavior is the MVRV Z-Score. This ratio compares Bitcoin’s current market price to its “realized price” (or cost basis), which represents the average holding price of all Bitcoins on the network. The Z-Score normalizes BTC’s raw MVRV data to exclude extreme outliers and make the data clearer.
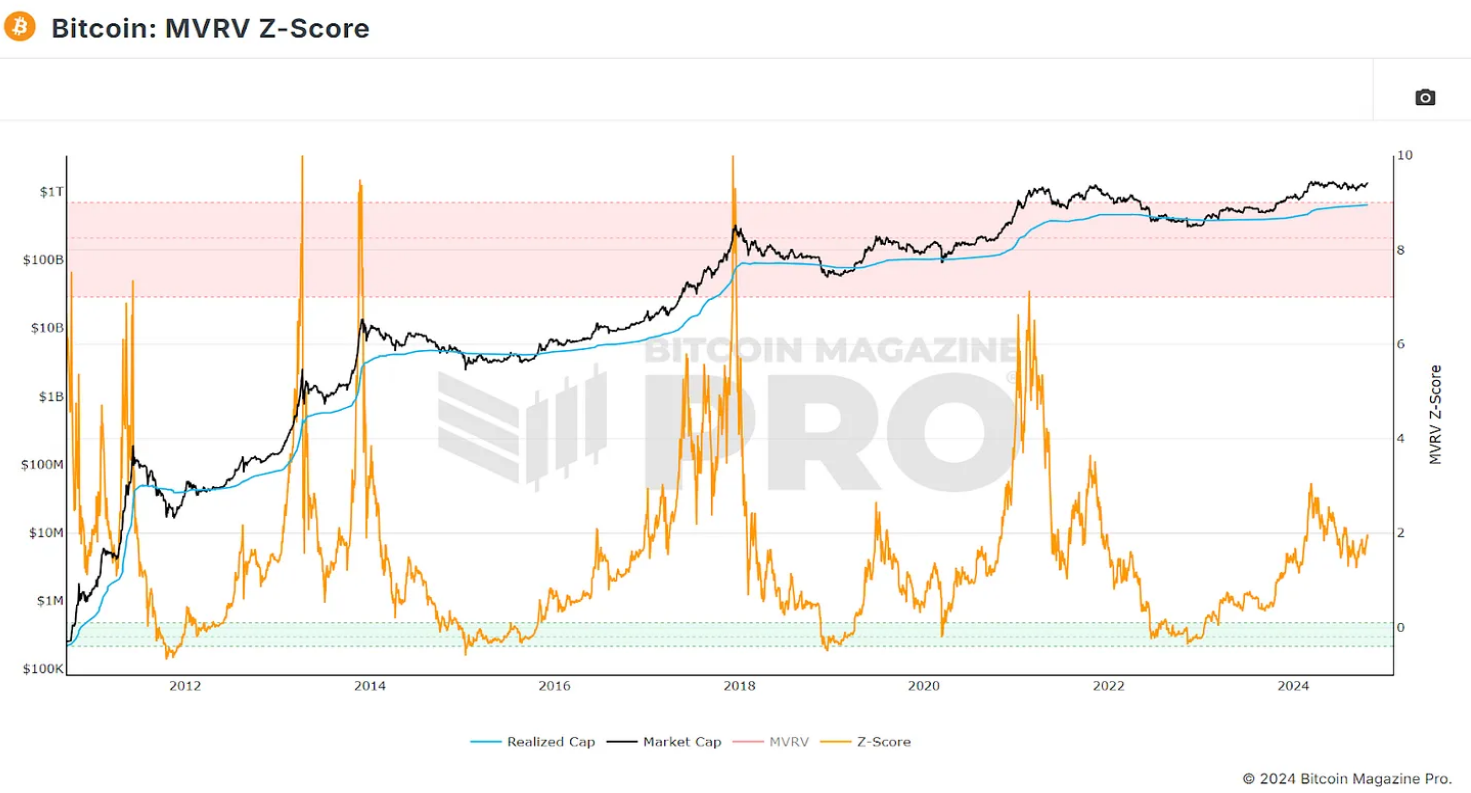
Figure 2: Bitcoin MVRV Z-Score provides insight into the profit and loss situation of the average investor.
Analyzing such indicators, rather than simply focusing on price movements, allows us to observe patterns and similarities between the current cycle and previous cycles, not only in price movements, but also in investor behavior and market sentiment.
3. Correlation analysis
To better understand the alignment of the current cycle with previous cycles, we refer to data provided by Bitcoin Magazine Pro, whose API provides in-depth insights. Excluding the Genesis cycle, which has little correlation with the current one, and isolating the price and MVRV data of Bitcoin from the lowest closing price to the highest point in the current and previous three cycles, we can clearly see similar correlations.
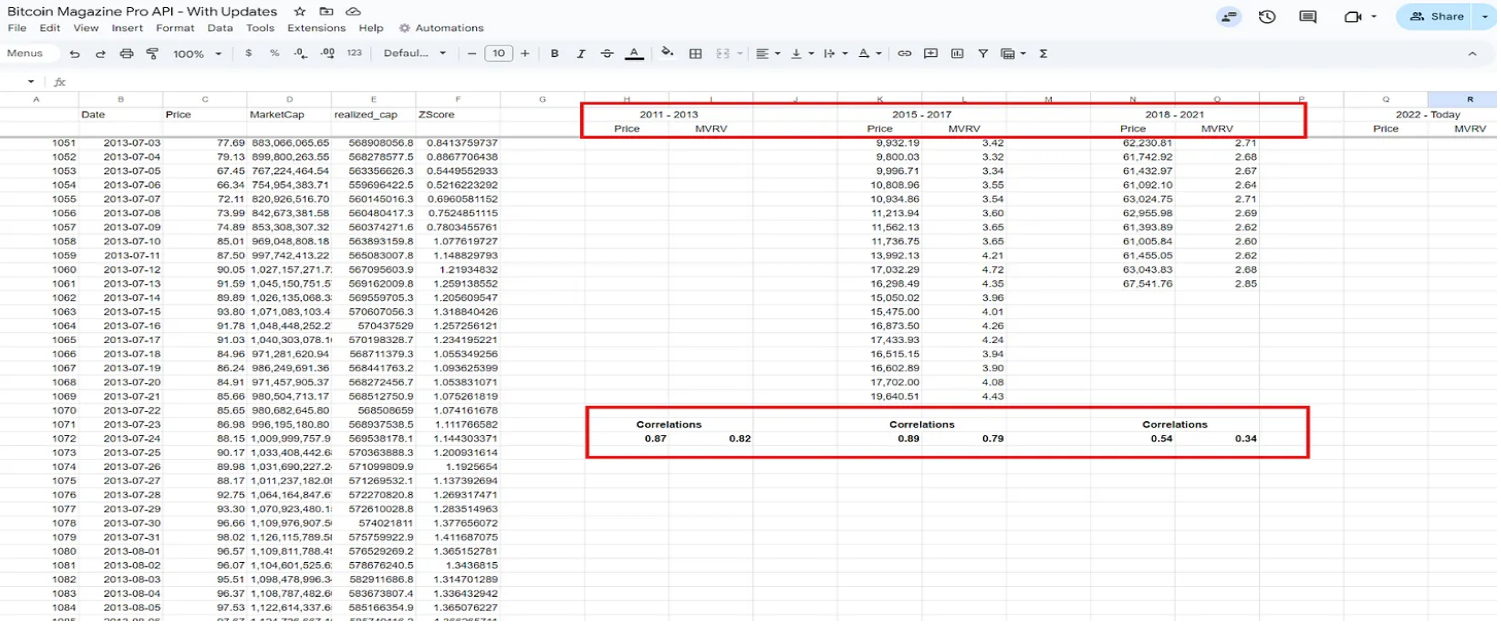
Figure 3: Price and MVRV correlation between the current period and the three previous periods.
2011 to 2013 cycle: This cycle is characterized by a double peak and has a high correlation of 87% with the current price trend. The MVRV ratio also shows a high correlation of 82%, which shows that not only the price performance of Bitcoin is similar, but investors' buying and selling behavior is also very close.
2015 to 2017 cycle: This cycle is actually the closest to the current cycle in terms of price action, with a correlation of 89%. However, the MVRV ratio is slightly lower, suggesting that despite similar price action, investor behavior may be slightly different.
2018 to 2021 Cycle: This most recent cycle, while positive, has the lowest correlation with the current trend, suggesting that the market may not be following the same pattern of a few years ago.
4. Are we getting another Twin Peaks?
The high correlation with the 2011-2013 cycle is particularly noteworthy. During this period, Bitcoin experienced a double peak, where the price climbed to new highs twice before entering a long bear market. If Bitcoin continues to follow this pattern, significant price volatility may occur in the coming weeks. When we superimpose the price action of that period on the current cycle and normalize the returns, these similarities are clear at a glance.
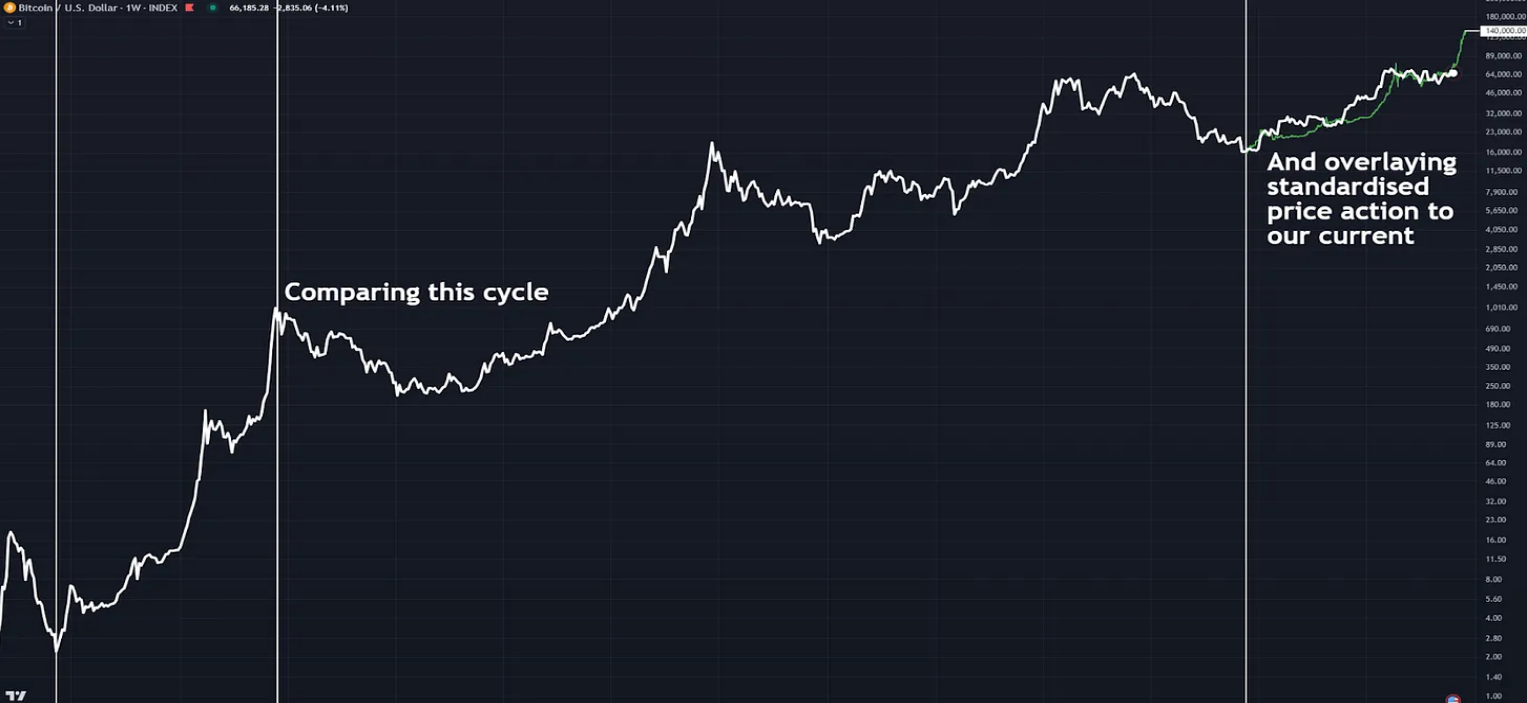
Figure 4: Superimposing the normalized fractal of the 2013 double peak cycle onto the current price action.
In both cases, Bitcoin experienced a rapid climb to new highs, followed by a long period of consolidation. If history repeats itself, we could see a significant increase in prices, perhaps to around $140,000 by the end of the year (taking into account diminishing returns).
Another important metric to watch for investor behavior patterns is Value Destroyed Days (VDD). This metric is weighted by the amount of Bitcoin moved and the time since its last transfer, then multiplied by the current price, providing insight into long-term investor behavior, especially with regard to profit taking.
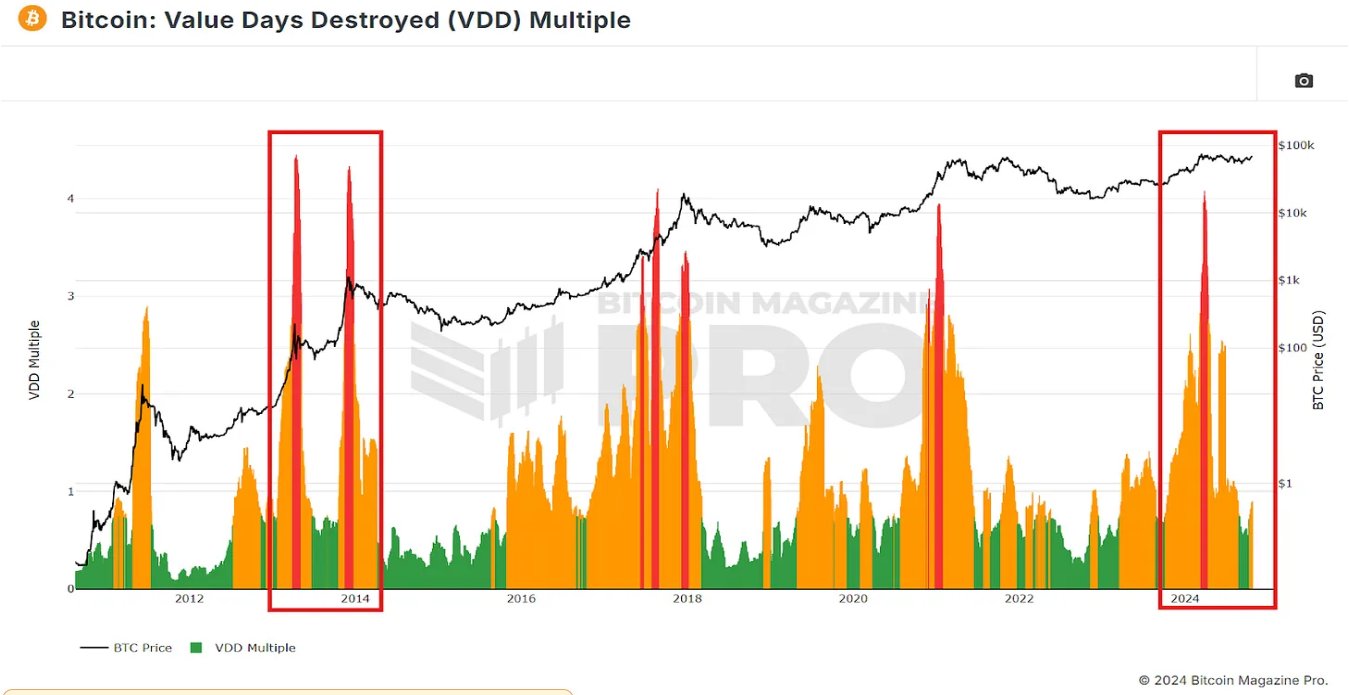
Figure 5: VDD’s initial surge and pullback confirm similarities in investor behavior.
In the current cycle, VDD has seen a red spike similar to the double peak cycle in 2013. This spike occurred before BTC hit new highs earlier this year, followed by a period of ongoing consolidation. If this double peak cycle pattern continues, we may soon hit new highs again.
5. A more realistic scenario
As Bitcoin grows and matures as an asset, the most recent two cycles have shown longer cycles and diminishing returns compared to the previous two cycles. Therefore, Bitcoin is more likely to follow the cycle that shows the strongest correlation with the current price action.
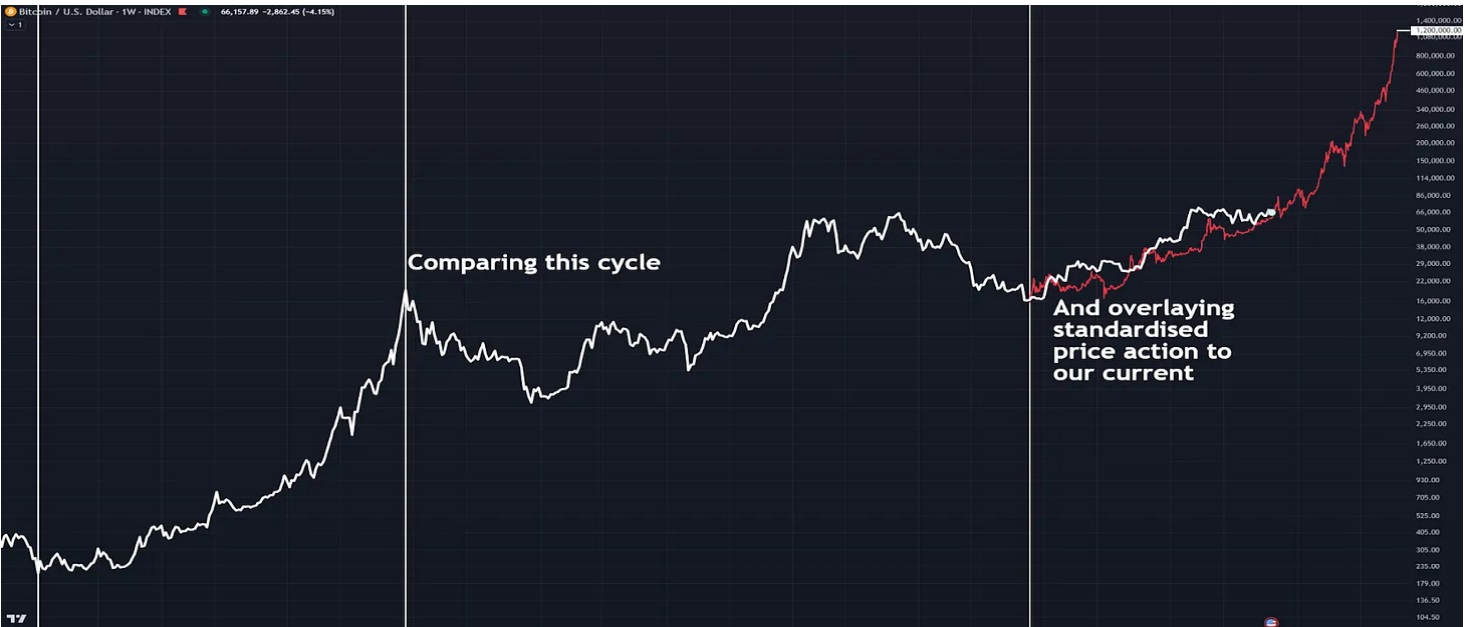
Figure 6: Superimposing the fractal of the 2017 cycle onto the current price action.
If Bitcoin follows the 2015-2017 pattern, it is still possible to break new all-time highs by the end of 2024, but the gains will be slower and more steady. This scenario predicts a price target of between $90,000 and $100,000 by early 2025. Continued growth throughout the year is likely to follow, with the market high likely to occur at the end of 2025, although a peak of $1.2 million may be too optimistic if this pattern is followed to the letter!
6. Conclusion
Historical data suggests that we are approaching a critical turning point. Whether Bitcoin follows the double-peak cycle of 2011-2013 or the slow rise of 2015-2017, the outlook remains bullish. Paying attention to key indicators such as the MVRV ratio and the number of days of value destroyed will further reveal the direction of the market, and comparing the correlation with previous cycles can also provide more insights into future trends.
Bitcoin is poised for a big move, whether in the next few weeks or in 2025. If BTC follows any of its past patterns even slightly, investors should prepare for significant price volatility and possible new highs.