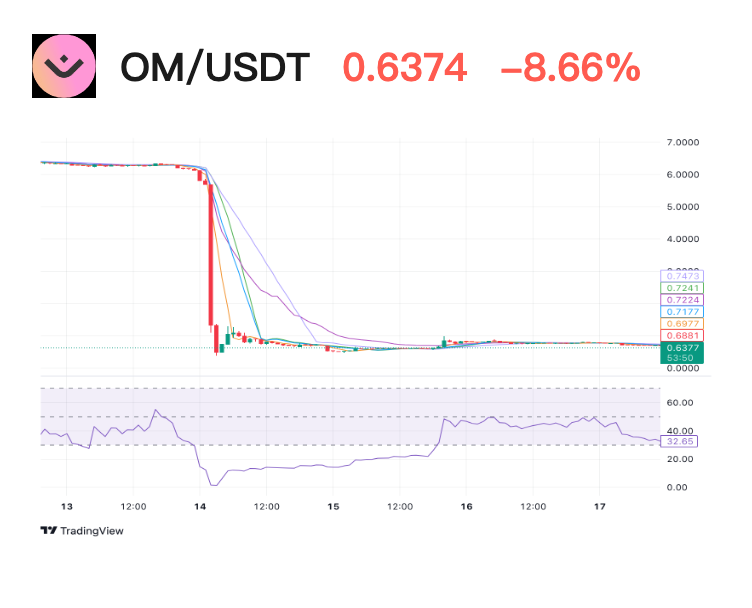
The MANTRA project token OM crashed in the early morning of April 14, with the price plummeting from $6.2 to a minimum of around $0.39, a price drop of more than 90% on the day. According to feedback analysis, the main reason for the plunge was the large-scale forced liquidation of the exchange and the recent adjustment of MANTRA's token economic model.
On April 18, according to BTCC market data, as of the time of writing, the price of OM token was US$0.6374, a daily drop of 8.66%, and the current price continues to be under pressure.
Technical indicator analysis:
Moving Averages: shows that the current price is in the oversold area, and the short-term moving average is still suppressing the current price. If a rebound occurs, it will form a potential resistance level.
Oscillators and Relative Strength Index (RSI): tend to be neutral and have not given a clear directional signal yet.
Technical indicator data reference: https://www.tradingview.com/symbols/OMUSD/technicals
Around the current price, OM may enter a sideways consolidation phase, and the market may try to find a new balance point.
Market reaction:
In the short term, OM continues to show high volatility. Some traders may try to buy low during the decline or take advantage of any good news about the project recovery, but this rebound is likely to be short-lived and cannot reverse the overall downward trend. The current market uncertainty and negative sentiment remain the main short-selling drivers.
Although the MANTRA team announced that they are destroying the team tokens and plan to create a comprehensive destruction program for the rest of the OM supply, the official also emphasized that the team did not sell any tokens during the OM crash, and the team and consultants' quotas are still fully locked. However, this price crash may cause the community to question the project's token market manipulation, which in turn may cause investors to have serious concerns about the future price performance of OM.
OM Token Economic Model Review
OM is the native token of the Mantra ecosystem. It has the following main uses: Users can stake OM tokens to participate in various DeFi activities on the Mantra platform, including lending and earning rewards. By staking OM, users can gain access to various financial tools and services on the platform and enjoy related economic incentives.
The total token supply of MANTRA DAO is 888,888,888 OM.
Of these, 75.6 million OMs (8.5%) were sold during the pre-sale and “initial membership offering” that began in July 2020. Another 80 million (9%) were allocated to a private offering with a six-month vesting period.
The remaining tokens are distributed as follows:
- 155.6 million OM (17.5%) for the team and advisors, with one-eighteenth OM circulated every 30 days.
- 266.7 million OM (30%) are reserved for staking rewards, most of which will be released over approximately five years with a non-linear decaying growth function.
- OM 111.1 million (12.5%) is used to fund the referral scheme, most of which will be rolled over in a linear model over approximately five years.
- OM88.9 million (10%) is reserved for reserves, most of which will be released in a linear rolling pattern over five years.
- OM 111.1 million (12.5%) to fund the protocol development program.